
Industry News
Curation by industry experts
Hot Articles
Popular Tags
How to Calculate Product Recovery System Payback from Yield, Energy, and Labor Savings
How to Calculate Product Recovery System Payback from Yield, Energy, and Labor Savings
For a finance team, a product recovery system is not justified by a recovery percentage alone. Whether the system is separating valuable material from wastewater, concentrating a process stream, reclaiming solvents, recovering metals, sorting secondary raw materials, or reducing disposal volumes, the investment case depends on the cash flow it changes over time.
That distinction matters. A supplier may present high projected yield, while operations sees a more complicated picture: variable feed quality, cleaning cycles, operator intervention, electricity demand at peak tariff periods, consumable replacement, and uncertain sales value for the recovered product. A credible product recovery system payback model converts those realities into a conservative, traceable capital approval case.
The central question is simple: how much net annual cash benefit will the installed system create after its own operating costs are deducted? The calculation is straightforward in form, but the assumptions require discipline.
Start with the right definition of payback
Simple payback measures the time needed for cumulative net benefits to equal the initial investment:
Simple Payback Period = Total Installed Capital Cost ÷ Annual Net Cash Benefit
Total installed capital cost should be broader than the quoted equipment price. Include engineering, civil works where relevant, electrical integration, piping, controls, commissioning, testing, operator training, startup inventory, and contingency. For a retrofit, production downtime and tie-in work may be material costs. For systems linked to high-risk streams, additional containment, monitoring, or validation requirements can alter the installed cost substantially.
Annual net cash benefit is the sum of financial gains that can reasonably be captured, less the new recurring costs created by the system. It is not the gross value of recovered material. It is also not a theoretical energy reduction before pumps, blowers, dryers, membrane trains, thermal units, conveyors, or automation systems are considered.
Simple payback is useful for screening competing projects, especially where internal capital rules set a maximum acceptable return period. It should not be the only approval metric for a long-life asset. Where cash flows extend over many years, net present value (NPV), internal rate of return (IRR), and lifecycle cost analysis provide a more complete decision basis. Still, a well-built payback model is often where approval begins.
Build annual benefit from four separate value streams
A recovery project usually combines several benefits. Keeping them separate is important because each uses different evidence, has different volatility, and may belong to a different cost center.
Yield value: calculate saleable or reusable output, not recovered mass
Yield is often the largest line in a recovery model, and the easiest one to overstate. The relevant value is not simply the mass captured by the equipment. It is the mass that meets the required specification and can actually be sold, reused in the process, or substituted for purchased virgin material.
A practical annual formula is:
Annual Yield Benefit = Throughput × Recoverable Content × Net Recovery Rate × Utilization × Net Unit Value
Net recovery rate should reflect real operating performance rather than a single best-condition trial. It may need to account for rejected fractions, startup losses, product degradation, moisture content, off-spec material, and periods when the system is unavailable. Utilization should likewise reflect planned cleaning, maintenance shutdowns, feed interruptions, and realistic production days.
The net unit value requires careful ownership. If recovered material displaces an internally purchased input, use the avoidable purchase cost only if procurement can reduce purchases. If it is sold externally, use an achievable netback after transport, packaging, brokerage, refining, and quality discounts. A quoted commodity benchmark is not automatically a cash benefit.
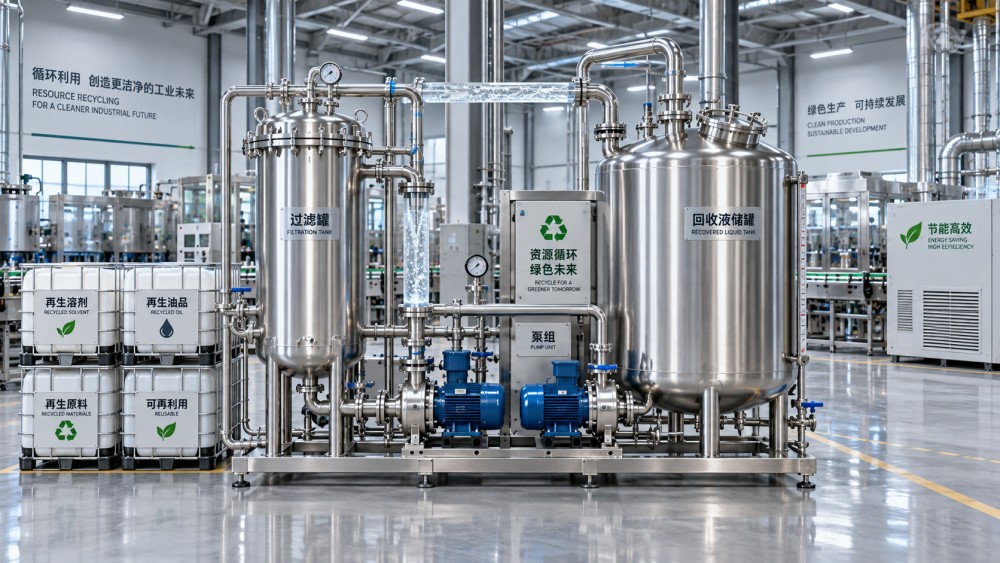
Energy savings: use the system boundary, not an isolated motor rating
Energy claims deserve a before-and-after boundary diagram. In water treatment and concentration systems, reducing downstream volume may save pumping, aeration, evaporation, hauling, or thermal treatment energy. But recovery equipment may add high-pressure pumping, mixing, heat, compressed air, filtration, centrifugation, or controls loads. The finance model needs the net result.
Calculate the baseline energy used to handle the current stream, then subtract the energy consumed by the proposed recovery train and any revised downstream process. Use measured kWh where available. If engineering estimates are necessary, document operating hours, expected load profile, and the tariff used. In facilities exposed to demand charges, a system that shifts load into peak periods can erode savings even when annual kWh fall.
Thermal recovery projects need extra caution. Fuel cost, boiler efficiency, steam pressure, condensate return, and seasonal operation can all affect the result. A nominal reduction in thermal duty is not equivalent to an equal reduction in purchased fuel.
Labor savings: distinguish removed work from moved work
Labor savings are credible only when an operational change captures them. Automation may reduce manual sorting, sampling, handling, cleaning, batch transfers, or waste preparation. Yet it may introduce routine inspection, calibration, quality checks, consumable handling, and more technical maintenance work.
A sound labor estimate compares task hours before and after installation. It should use a fully loaded labor rate, including benefits and shift premiums where those costs are genuinely avoidable. If personnel will be reassigned rather than reduced, the benefit may still exist as recovered capacity or avoided future hiring, but it should not be presented as immediate payroll savings. Label it correctly.
Do not let operating costs disappear from the model
The annual net cash benefit should include every material recurring cost:
Net Annual Benefit = Yield Value + Energy Savings + Labor Savings + Avoided Disposal/Compliance Cost − Energy Used − Consumables − Maintenance − Added Labor − Residue Handling − Other Recurring Costs
Consumables can include membranes, filter media, chemicals, adsorbents, catalysts, bags, liners, reagents, cleaning agents, or wear components. Maintenance should account for planned service as well as expected replacement of critical parts. For a process that depends on high availability, the model should also consider production disruption during major maintenance, even if this is handled as a sensitivity rather than a fixed annual cost.
Residual management is frequently underestimated. A recovery system may transform a dilute waste stream into a smaller but more concentrated residue. That can be operationally beneficial, but its transport, treatment, storage, or classification needs to be understood before disposal savings are booked.
Use three scenarios instead of one optimistic number
A single payback period implies a level of certainty that most recovery projects do not have. A better approval package presents downside, base, and upside scenarios. The base case should be built from the most defensible operating assumptions, not the supplier’s maximum performance point. The downside case should test the variables most likely to move: feed concentration, product price or transfer value, runtime, electricity tariff, recovery efficiency, and consumable life.
For example, a project may appear attractive because of recovered-product revenue, but sensitivity analysis may show that payback changes sharply when feed composition declines or recovered material fails to meet a buyer’s specification. Another system may have less headline upside but a more stable case because its value comes from documented disposal avoidance and labor capacity. Finance approvers should prefer visibility over false precision.
Where possible, show the breakeven condition: the minimum recovery rate, annual operating hours, or net product value required to meet the organization’s payback threshold. This turns a static spreadsheet into a useful operating commitment.
Compliance value belongs in the decision, but not as invented revenue
Recovery systems can reduce exposure to discharge constraints, landfill restrictions, waste transport risk, water scarcity, or carbon-related reporting pressure. In some projects, this resilience is the real strategic rationale. However, not every compliance benefit should be converted into a cash figure.
Include a monetary value when there is a verified avoidable cost: a documented treatment charge, permit-related operating requirement, contracted hauling expense, or planned capital expenditure that the project defers. For broader risk reduction, keep the benefit visible in the approval narrative and risk register rather than assigning an unsupported number. This is particularly relevant where environmental obligations are changing or site-specific requirements remain subject to regulatory confirmation.
The Global Eco-Shield Dynamics (ESD) follows these intersections across large water treatment, ZLD, solid waste recovery, desalination, flue gas treatment, and nuclear waste management. Across these fields, the same financial lesson appears repeatedly: extreme purification performance has value only when it is connected to feed variability, energy intensity, residual handling, reliability, and the applicable compliance pathway.
Questions to resolve before capital approval
- What historical data proves average and low-case feed composition, throughput, and operating hours?
- Is the quoted recovery rate measured on the actual feed, at the required product specification, and over a representative operating period?
- Who will purchase or reuse the recovered output, and what quality, logistics, and price assumptions support its net value?
- Which baseline costs will truly disappear after installation, rather than merely move to another department or process step?
- What are the warranty boundary, performance-test conditions, expected consumables, spare-parts lead times, and maintenance responsibilities?
- Does the project require permitting, hazardous-material review, wastewater characterization, grid upgrades, or production downtime that changes timing or cost?
These questions also make supplier comparisons fairer. Two proposals with similar purchase prices may produce very different lifecycle economics if one includes automation, commissioning support, monitoring instrumentation, or a defined performance test while the other leaves those items to the buyer.
A defensible recovery investment is built from operational evidence
The best product recovery system payback calculation is neither a sales forecast nor a purely engineering estimate. It is a reconciled model owned by operations, maintenance, procurement, environmental teams, and finance. Operations validates throughput and downtime. Procurement verifies prices and contract exposure. Maintenance challenges spare parts and service assumptions. Environmental specialists confirm what residuals and compliance costs are actually affected. Finance decides which benefits are cash-releasing and which are strategic but non-cash.
Before approval, request a model with every assumption visible, a stated system boundary, and a downside case that management can accept. If the project only works under perfect feed quality, full uptime, premium product pricing, and zero maintenance surprises, the payback is not yet ready for capital approval. If it remains viable after reasonable adjustments to those variables, it is much closer to a decision that can withstand both commissioning and scrutiny.
Recommended News
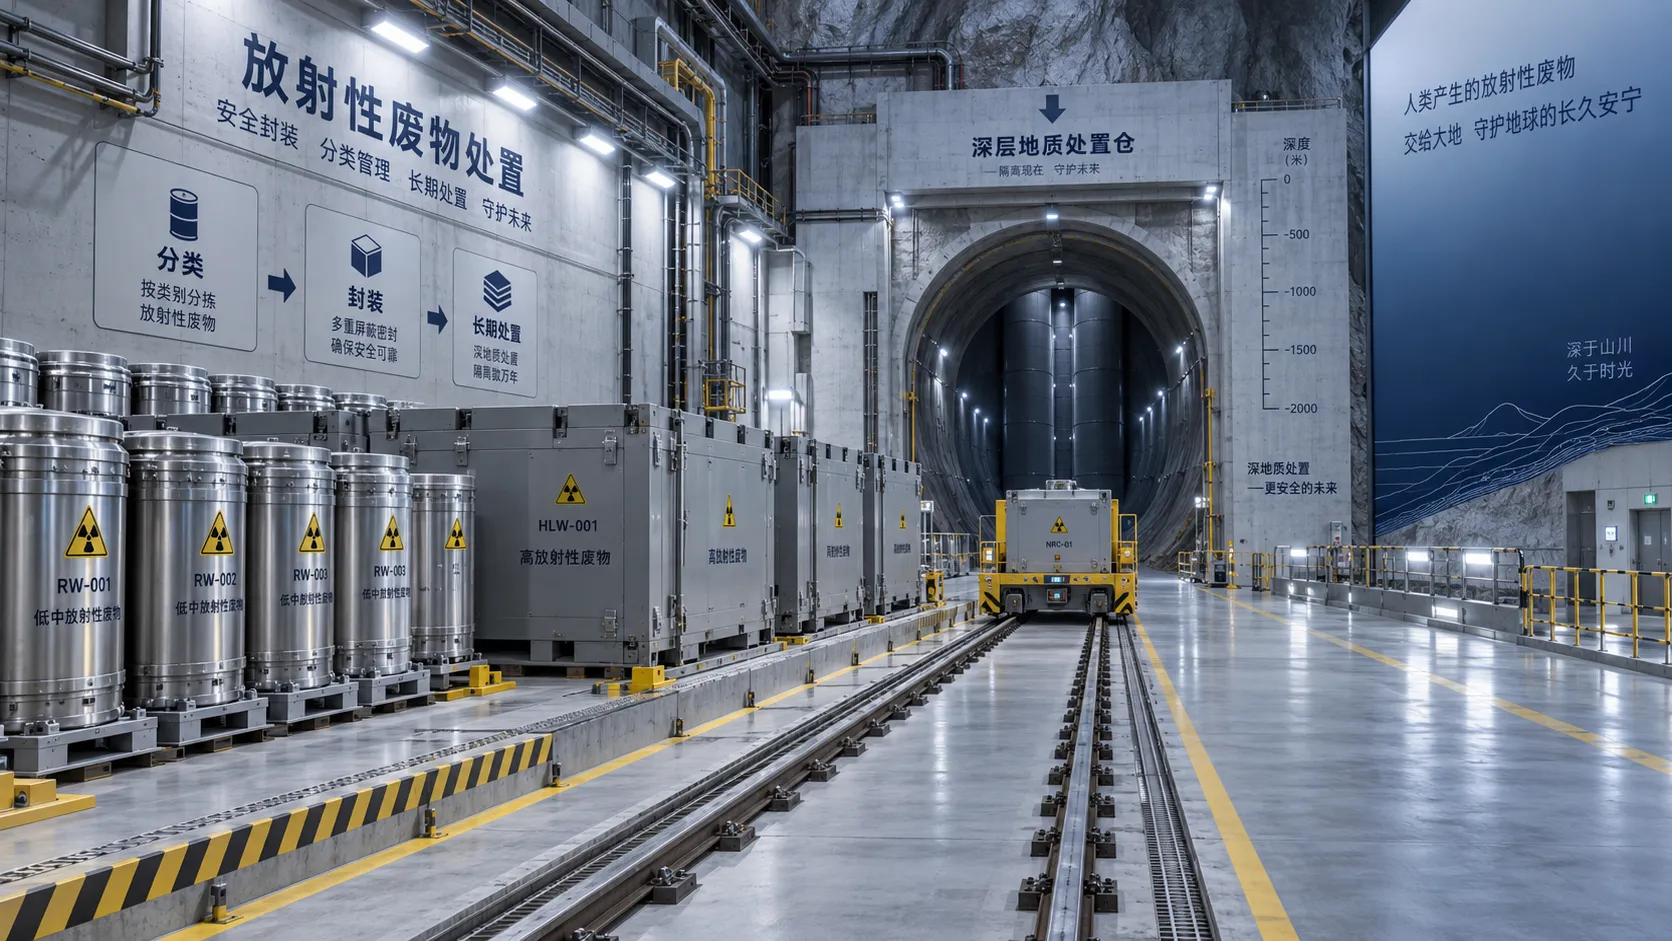
What drives radioactive waste cost over the life of a disposal project?
Radioactive waste cost depends on classification, treatment, transport, storage, disposal access, and long-term compliance. Explore the key lifecycle cost drivers.
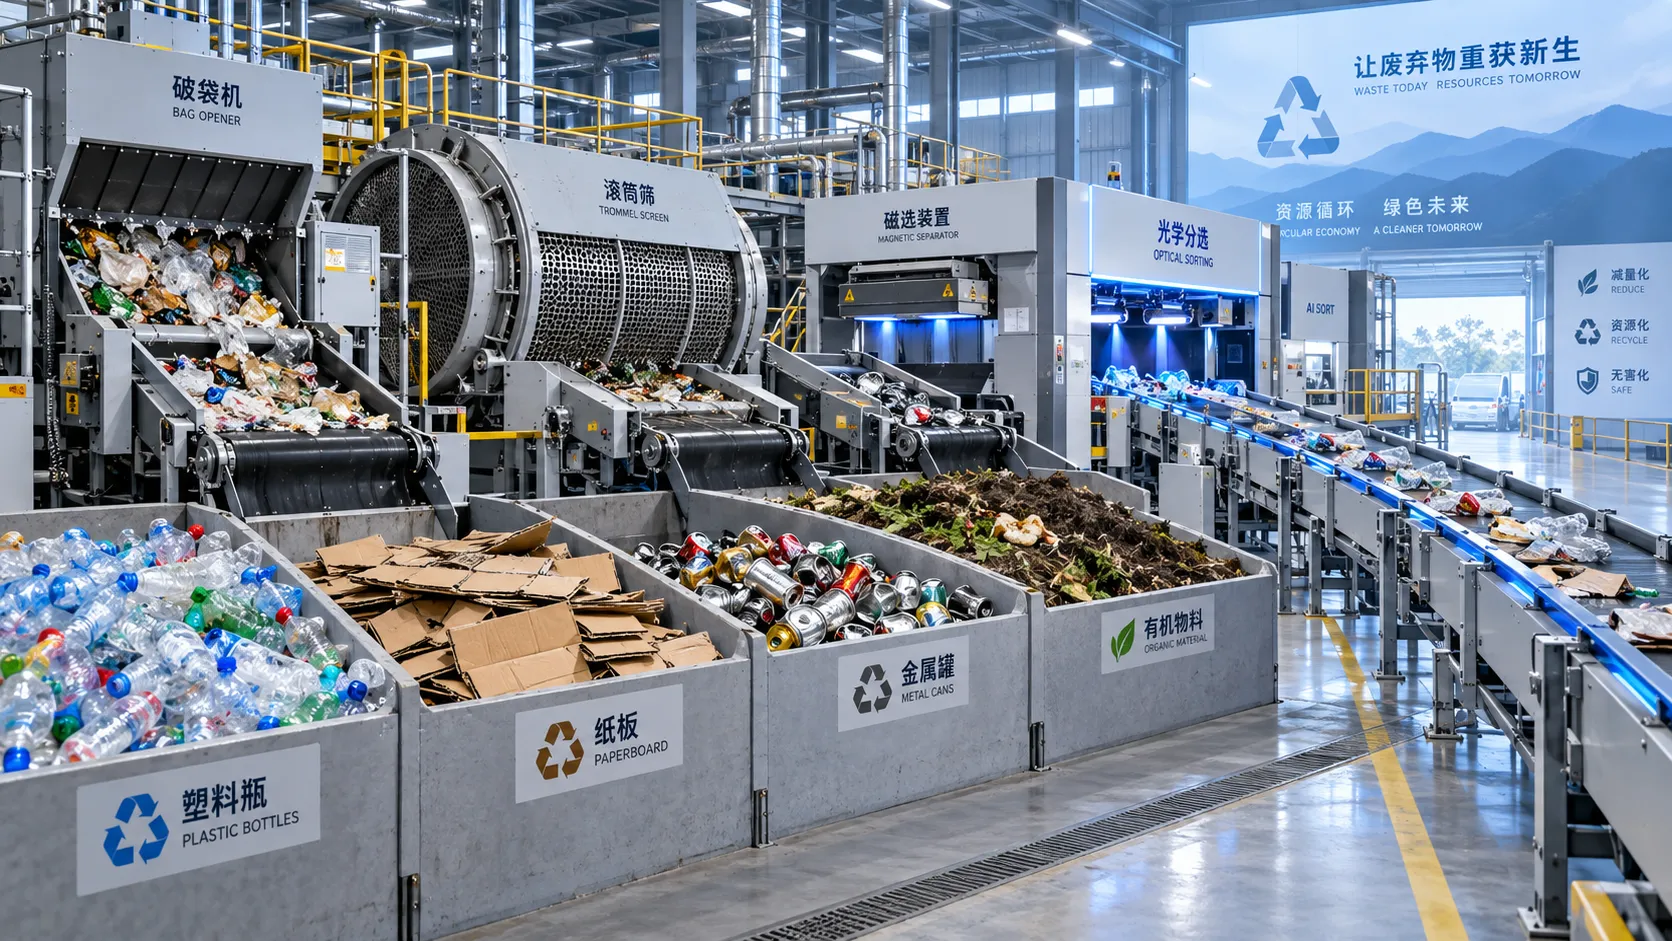
How to choose solid waste equipment based on waste stream characteristics
Environmental equipment guide for solid waste: discover how to match sorting, treatment, and recovery equipment to waste composition, moisture, contamination, and output goals.
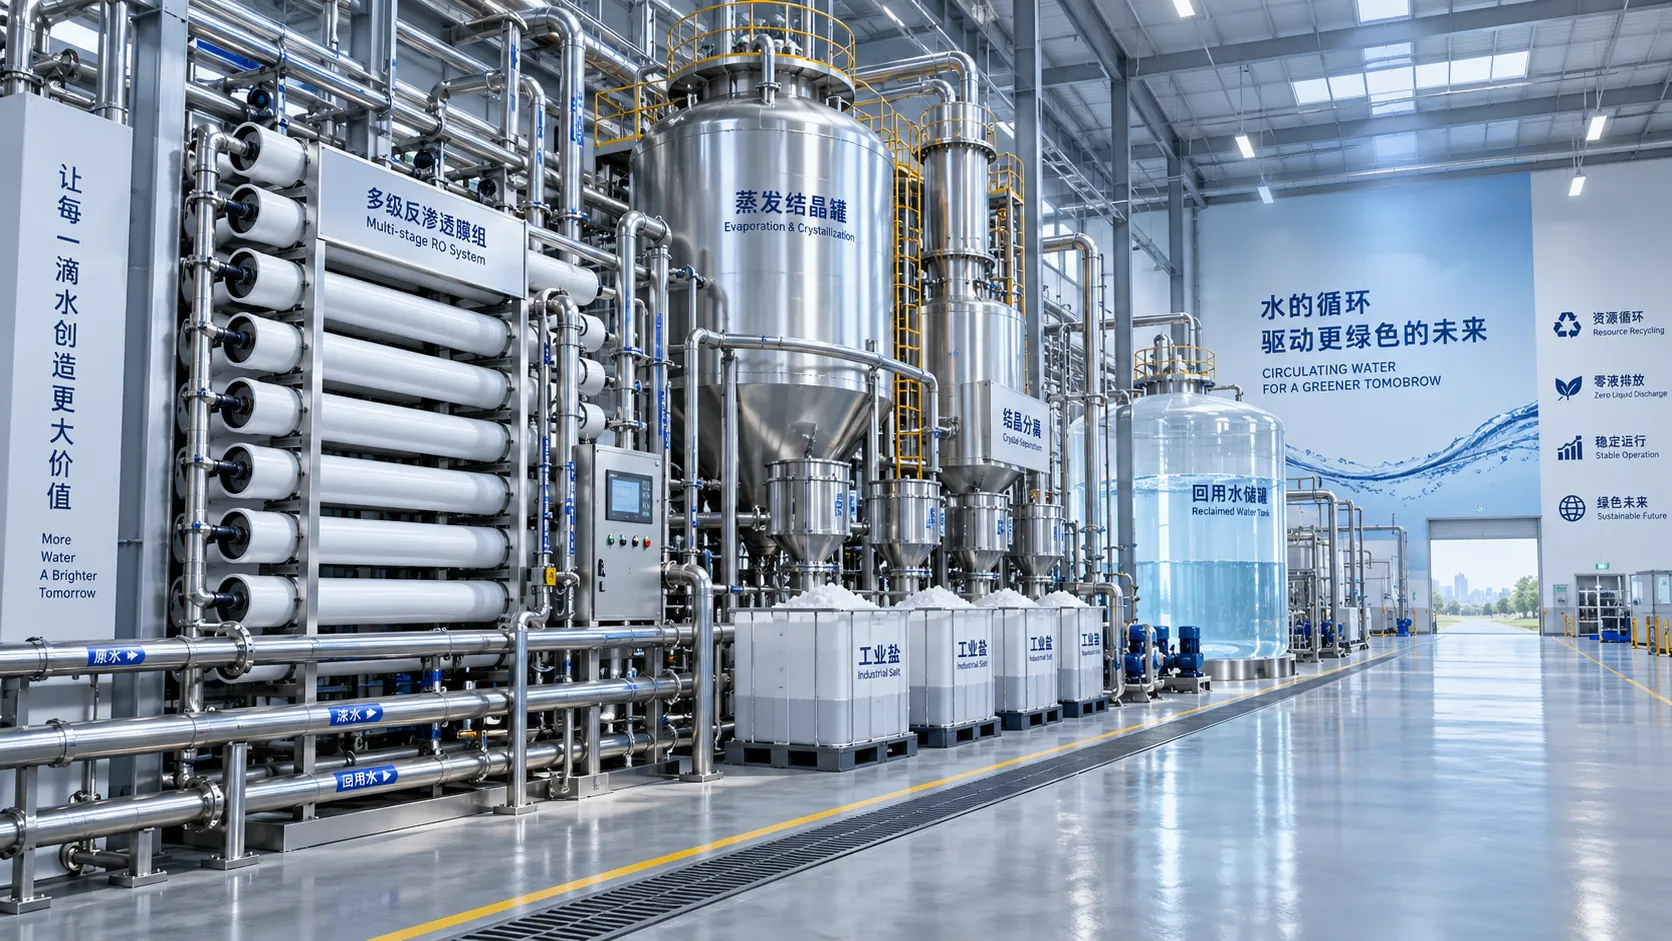
When does high recovery ZLD equipment justify its higher capital cost?
High recovery ZLD equipment can justify higher capital cost when water scarcity, discharge risks, brine disposal, and downtime threaten operations. Explore the decision factors.

How high purity heavy metal recovery affects recovered metal value
High purity heavy metal recovery boosts recovered metal value by improving payability, reducing penalties, and unlocking stronger buyer opportunities. Explore smarter netback strategies.
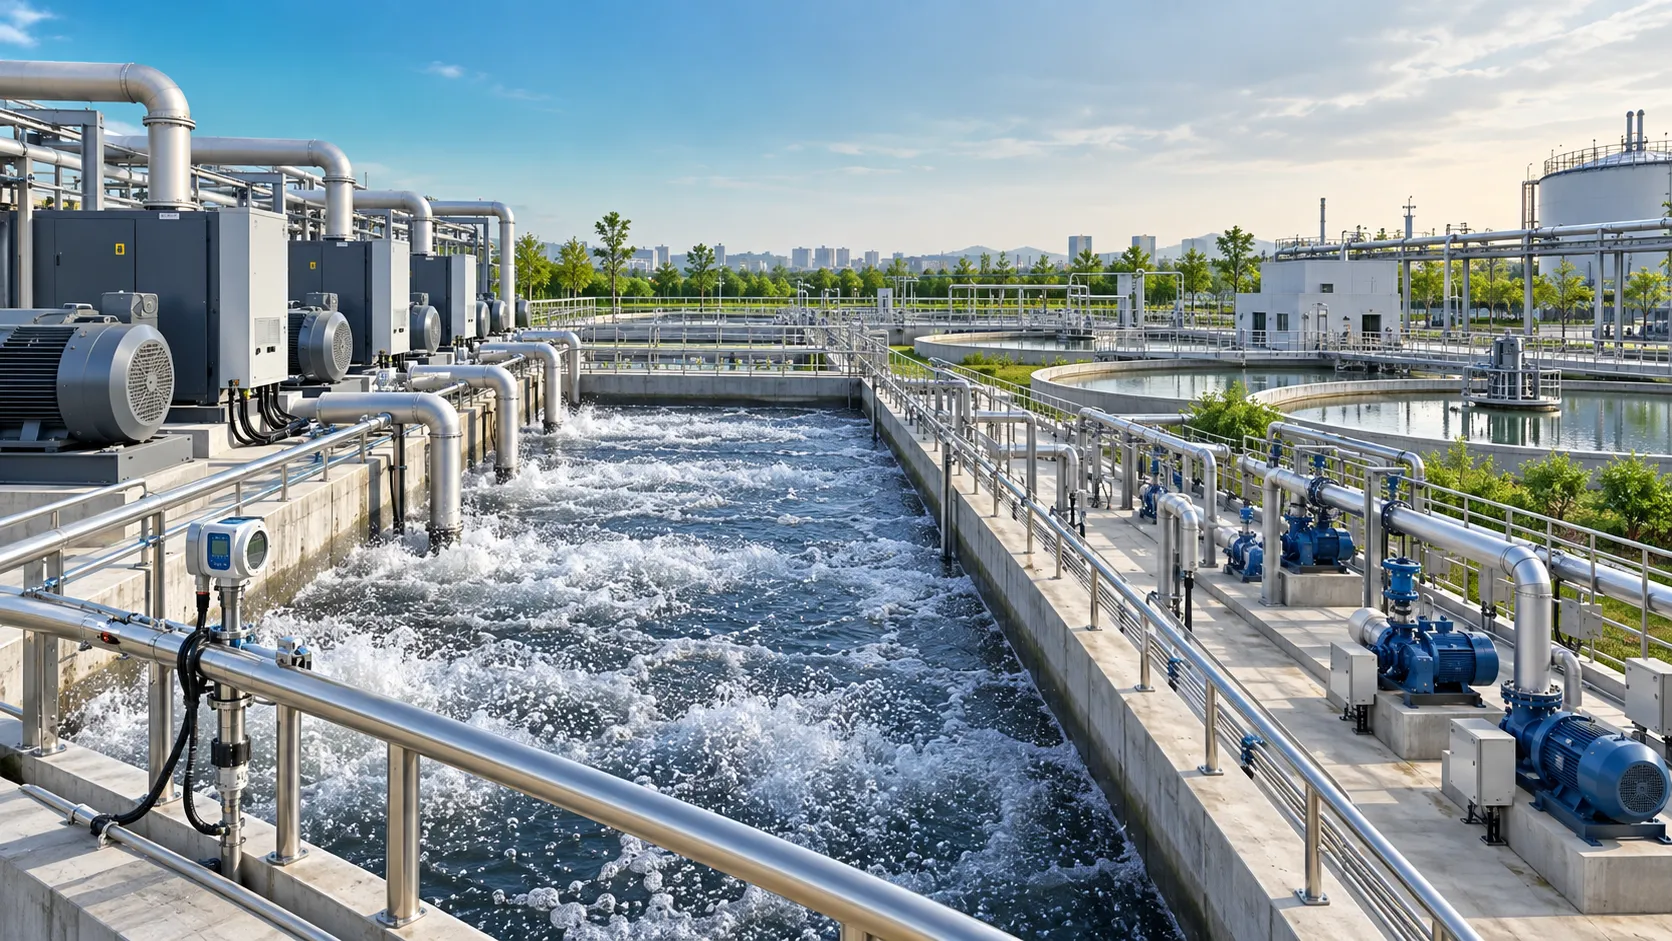
When does environmental equipment intelligence reduce wastewater plant energy use?
Environmental equipment intelligence for wastewater plants cuts energy use through smarter aeration, pumping, and data-driven controls—without compromising compliance. Discover when it delivers measurable savings.
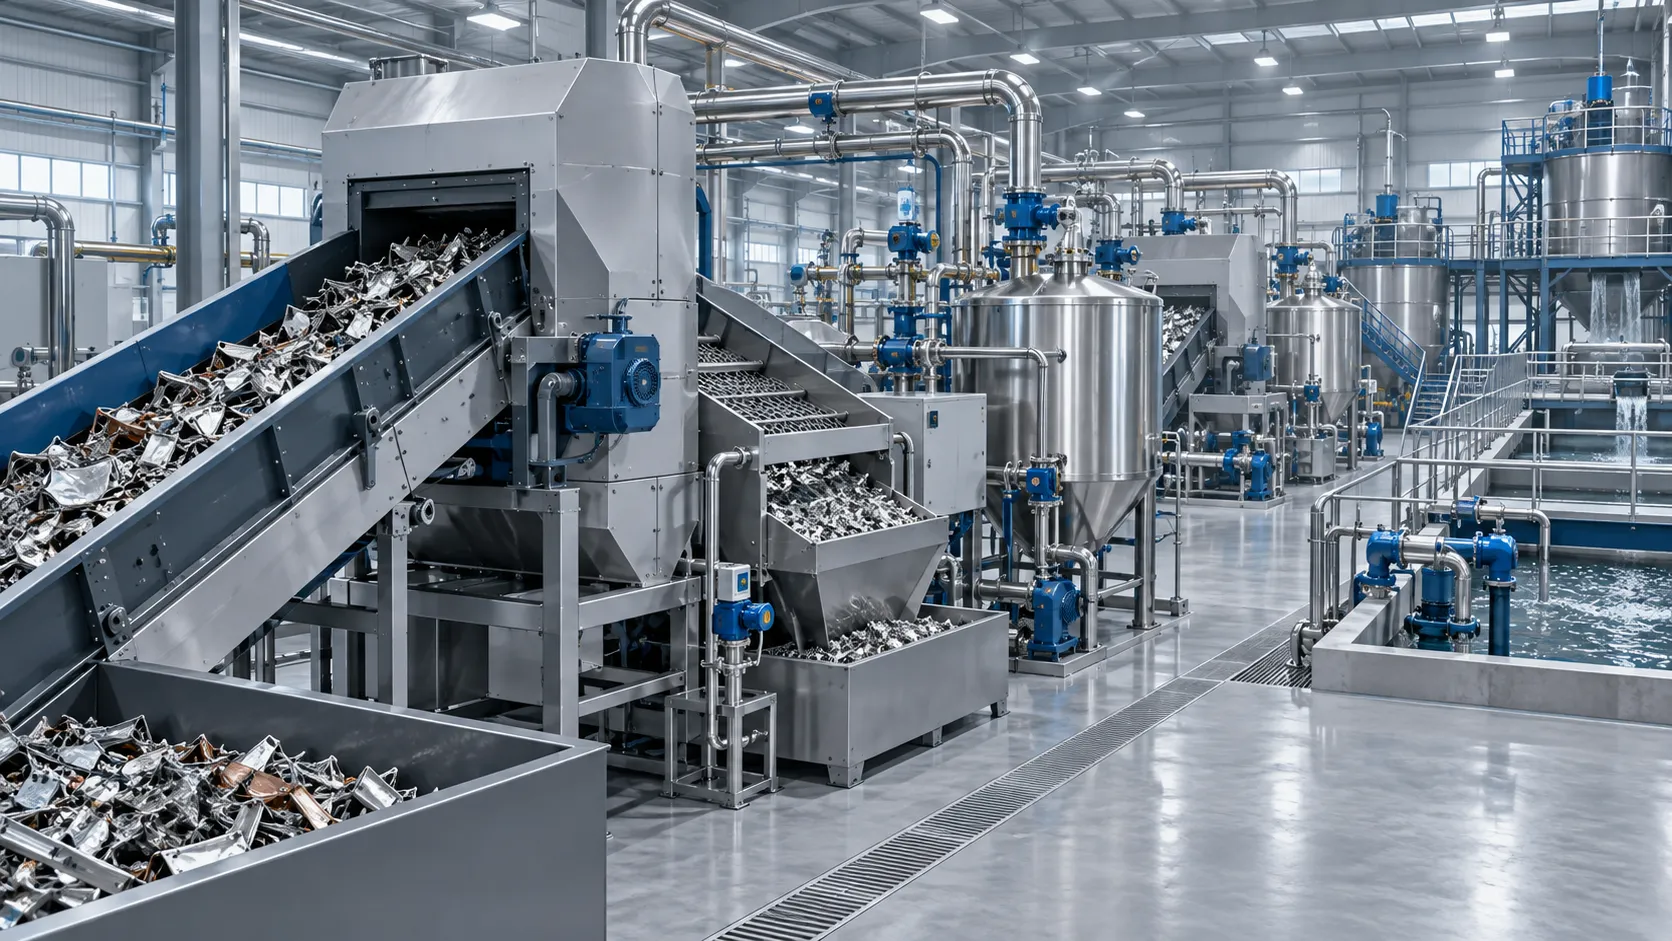
What Makes Metals Recovery Infrastructure Repeatable Across Multiple Plant Sites?
Repeatable metals recovery infrastructure: learn how standardized processes, modular design, data control, and compliance-ready systems enable scalable multi-site recovery plants.
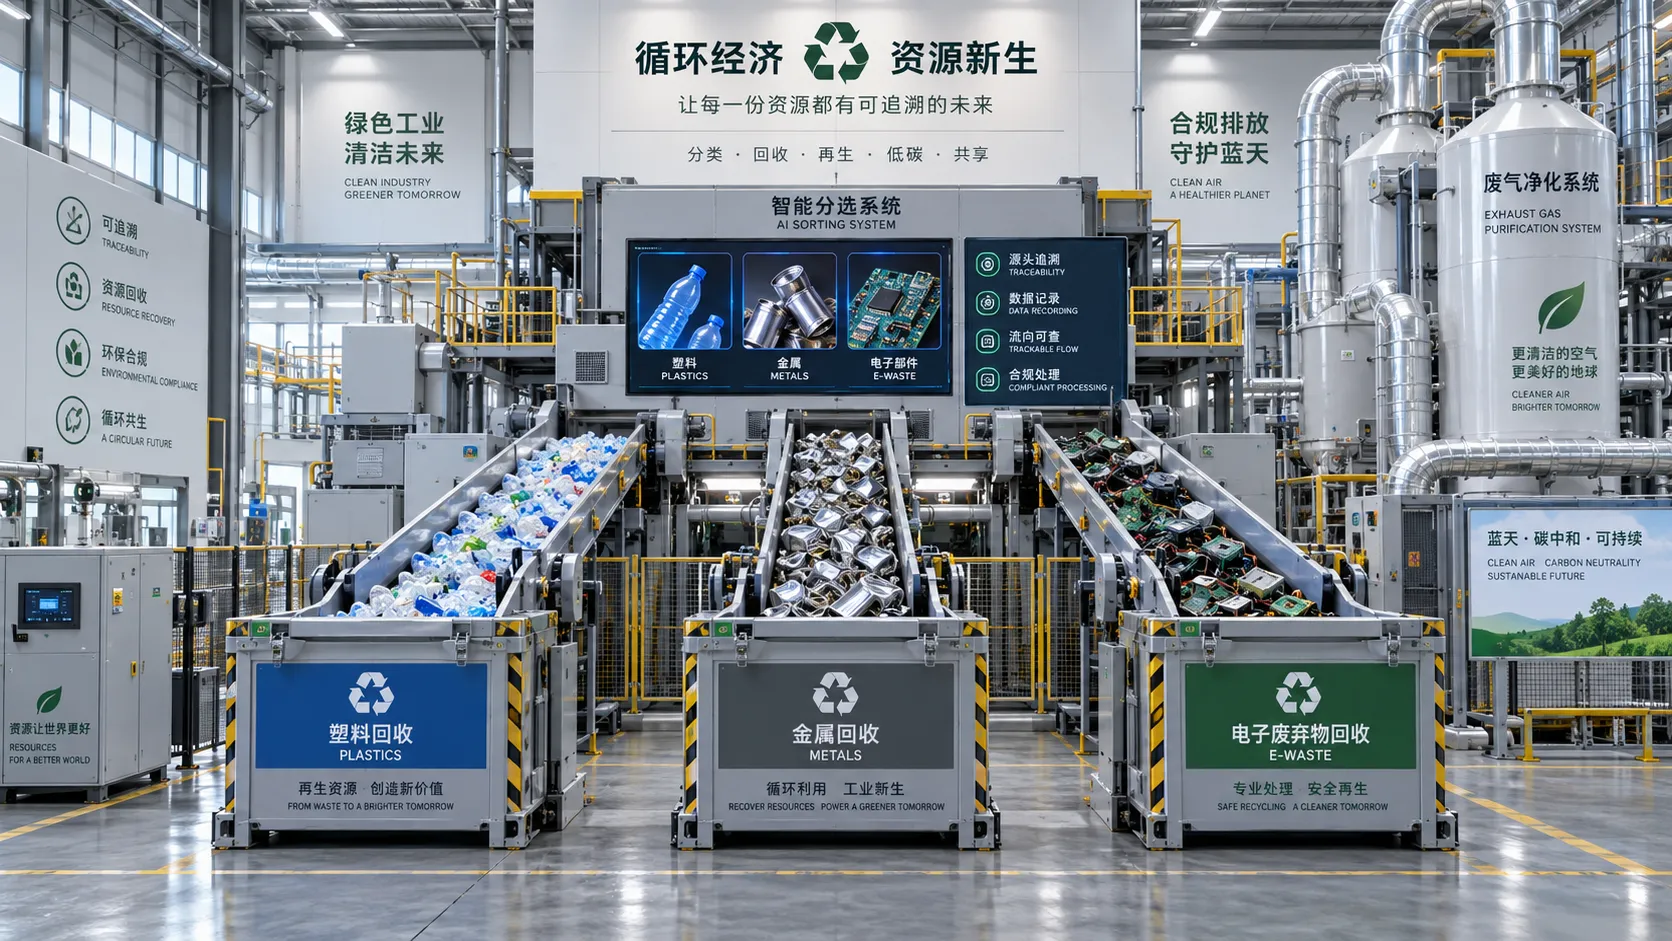
Waste Management and Circular Economy Regulations to Watch in 2025–2026
Recent regulatory updates in waste management and circular economy 2025-2026: explore PPWR, EPR, waste shipments, PFAS controls, and practical compliance steps.
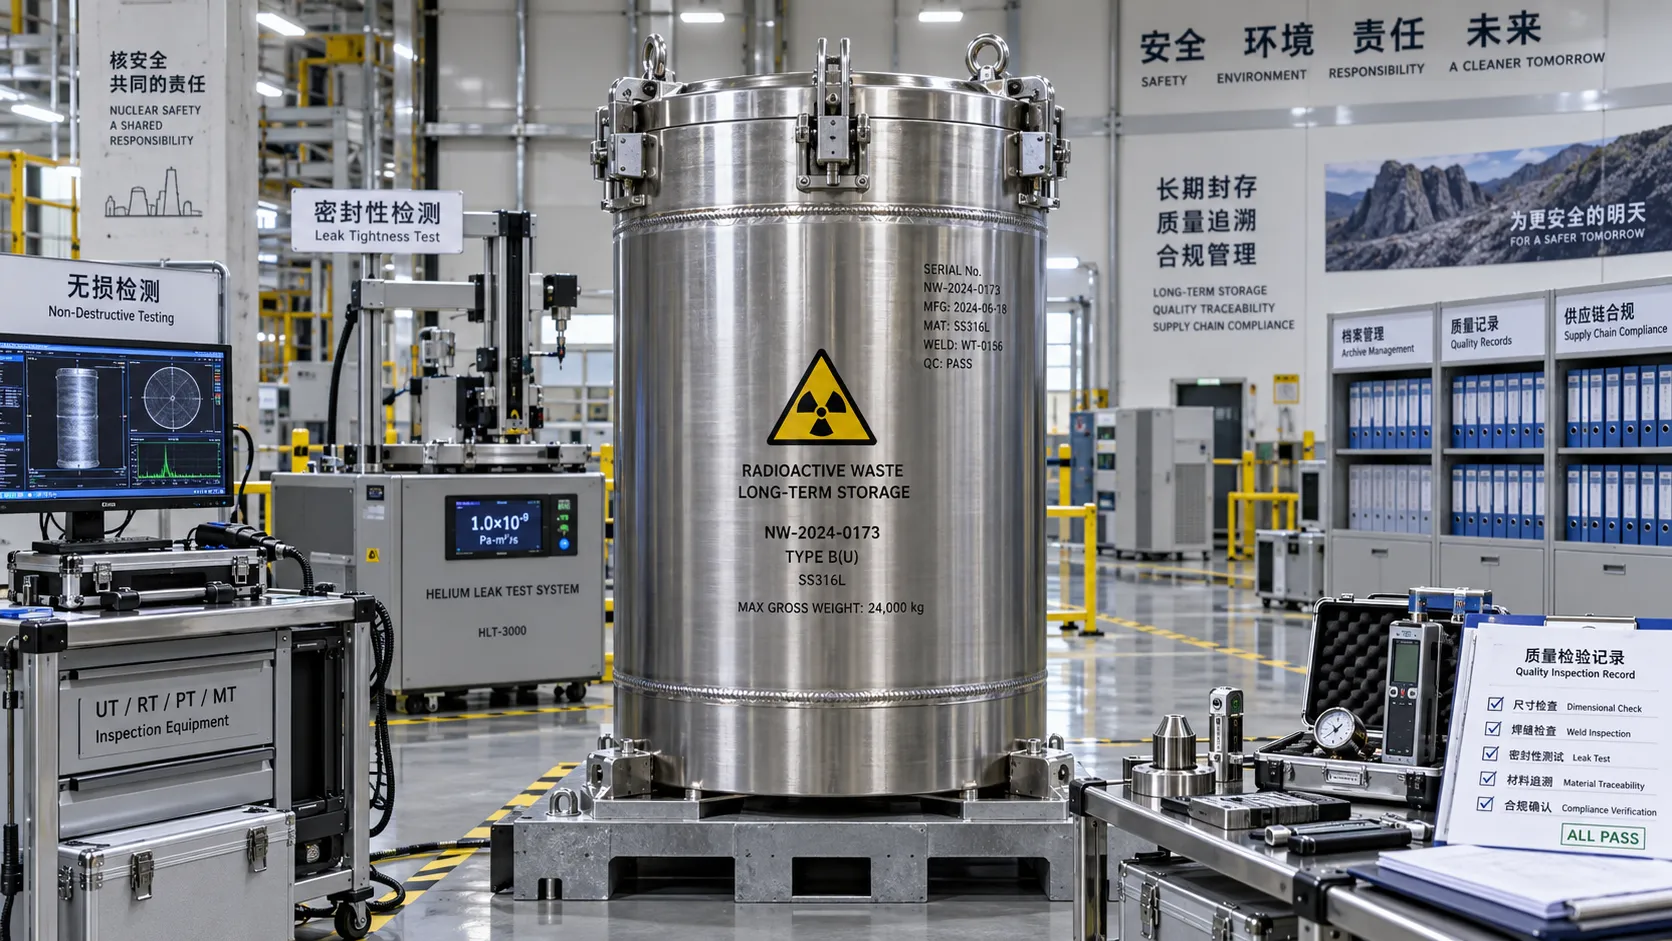
How to Qualify Nuclear Waste Supply Chain Partners for Long-Term Projects
Nuclear waste supply chain partner qualification: learn how to verify technical capability, compliance, traceability, resilience, and lifecycle support for long-term projects.
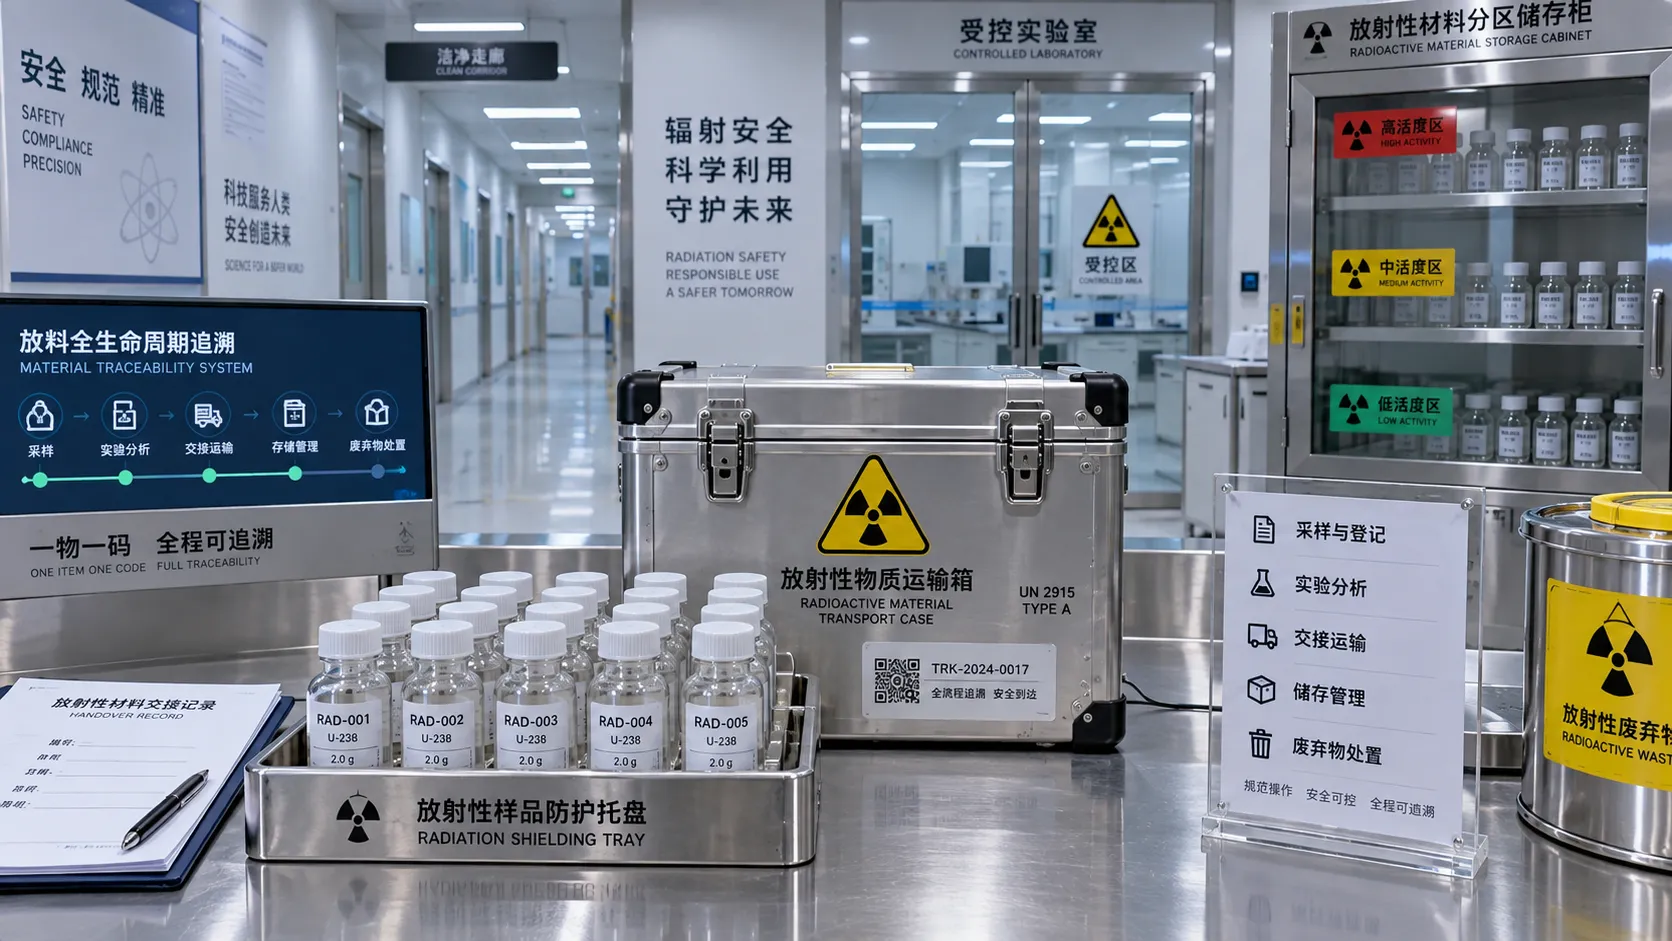
Choosing a Radioisotope Management System for Multi-Site Research Facilities
Radioisotope management system guide for multi-site research facilities: compare traceability, chain of custody, waste controls, roles, and integrations.