
Industry News
Curation by industry experts
Hot Articles
Popular Tags
How energy use affects wastewater purification lifecycle costs
Energy use can turn a lower-priced wastewater treatment system into the more expensive investment over its operating life. The outcome depends not only on how many kilowatt-hours a process consumes, but also on when it consumes them, what treatment performance it delivers, and whether its energy demand creates savings or additional costs elsewhere in the plant.
A credible lifecycle comparison therefore needs a common treatment duty and a complete cost boundary. Aeration, pumping, membrane filtration, sludge handling, and thermal concentration can all affect the electricity or fuel bill. Their importance changes with wastewater composition, discharge or reuse requirements, plant utilization, and the local energy tariff.
Why the purchase price is an incomplete comparison
A wastewater purification lifecycle cost assessment combines the initial investment with the discounted costs of operating, maintaining, and renewing the system over an agreed period. Energy is one part of that calculation, alongside labor, chemicals, consumables, sludge disposal, planned equipment replacement, and other relevant costs.
The cheapest equipment can be expensive to run if it relies on inefficient blowers, excessive pumping pressure, or energy-intensive treatment where a simpler process would meet the same effluent requirement. The reverse is also possible: a premium efficiency package may not earn back its additional capital cost if the plant operates infrequently or electricity is inexpensive.
Comparisons become misleading when suppliers price different scopes. A proposal that excludes sludge dewatering, feed equalization, or concentrate management may appear to have lower energy costs simply because some of the work has been moved outside the quoted system. The financial boundary should include all equipment needed to deliver the specified outcome, even if some items are supplied under a separate contract.
That outcome must also be consistent. Treating wastewater to a discharge limit is not necessarily equivalent to producing water suitable for industrial reuse. A higher-quality effluent can require extra filtration, disinfection, or desalting, but it may also offset purchased water or discharge costs. Those benefits should be counted only where the project can use them and where the underlying prices and volumes are supportable.
Where treatment energy is consumed
Aeration and biological treatment
In aerobic biological treatment, blowers supply oxygen to microorganisms that remove biodegradable pollutants. The required air flow depends on pollutant loading, treatment targets, process configuration, and oxygen transfer performance. A low quoted blower power at one operating point does not establish how much electricity the biological stage will consume across a year.
Wastewater loading varies, and treatment systems must continue to perform during both high and low demand. Controls, blower turndown, diffuser condition, and the ability to match oxygen supply to process needs can influence actual consumption. Poor air distribution or fouled diffusers can increase the air and power required to maintain the same treatment performance.
A design that reduces aeration demand should still be assessed against its complete operating consequences. For example, changing the biological process may affect chemical use, sludge production, tank volume, or the ability to meet nutrient limits. Energy savings have value only when the revised design delivers the required effluent reliably.
Pumping, filtration, and membranes
Pumping costs depend on flow, pressure, operating hours, and overall pump and motor efficiency. Elevation changes, long pipe runs, filters, and membrane systems can all add pressure requirements. An efficient pump cannot compensate economically for an unnecessarily high system pressure or a design that repeatedly moves the same water between stages.
Membrane filtration introduces a further lifecycle consideration: energy consumption can rise as membranes foul and resistance increases. Cleaning and replacement restore performance but add chemical, labor, downtime, and consumable costs. A proposal based only on clean-membrane power may understate the annual average; one based only on a heavily fouled condition may overstate it. The assumed operating profile and cleaning frequency matter.
For pressure-driven desalting processes, recovery also affects the economics. Higher recovery can reduce the volume of liquid sent to disposal, but it can increase concentration, fouling or scaling risk, and pressure requirements. The preferred recovery is therefore a site-specific balance between energy, pretreatment, membrane life, and concentrate management—not simply the highest achievable percentage.
Sludge and concentrated waste streams
Liquid treatment does not eliminate the need to manage the solids and concentrates it produces. Mixing, thickening, dewatering, drying, and transport all have cost implications. A dewatering system that uses more electricity may reduce hauling and disposal expenditure by producing a drier cake; whether it is economical depends on the achievable solids content, disposal charging method, and equipment costs.
Thermal evaporation or drying can add substantial fuel, steam, or electricity demand when very low liquid discharge volumes are required. The relevant comparison is not just evaporator energy per cubic meter of feed. It also includes pretreatment, heat supply, residual solids management, and any disposal costs avoided. Where waste heat is proposed, its availability, temperature, competing uses, and backup supply need to be reflected in the assessment.
Convert power demand into a financial comparison
The starting point is annual energy consumption, not installed motor capacity. Installed kilowatts indicate equipment size; annual kilowatt-hours depend on actual loading and operating time. A plant designed for a peak flow will not necessarily run at that flow or power continuously.
A simplified calculation is:
Annual electricity cost = annual electricity use (kWh) × applicable energy rate
This is useful for screening, but a procurement model should use the relevant tariff structure. Electricity contracts can include time-of-use prices, demand charges based on peak power, and other charges that do not vary directly with kilowatt-hours. Two systems with the same annual consumption can have different bills if one draws more power during expensive periods or creates a higher peak demand.
Consider an illustrative comparison in which two complete systems meet the same treatment requirements and operate at the same throughput. System A is expected to use 1,000,000 kWh per year; System B uses 800,000 kWh. At a flat assumed rate of $0.15 per kWh, B saves $30,000 per year. If B costs $180,000 more to install, the simple energy-only payback is six years.
That six-year figure is not the lifecycle result. It excludes discounting, demand charges, energy price changes, maintenance differences, replacements, and any effect on chemicals or waste disposal. It also assumes the 200,000 kWh annual saving is achieved every year. If the plant runs below its expected throughput, the saving may fall while part of the power demand remains fixed.
A discounted comparison expresses future costs in present-value terms:
Lifecycle cost = initial capital cost + present value of annual operating costs + present value of replacements and end-of-period costs − present value of any residual value
The same assessment period, discount rate, energy price assumptions, and treatment volumes should be used for every option. Financing costs and taxes should be handled consistently with the organization’s investment method rather than included for one supplier and omitted for another. If prices and discount rates are stated in real terms, escalation assumptions should also be real; if stated in nominal terms, they should include inflation consistently.
Normalize performance before comparing energy figures
Specific energy consumption, expressed as kWh per cubic meter treated, is a useful comparison only when the underlying conditions are comparable. Influent strength, flow, effluent targets, recovery, and included equipment can materially change the result. Dividing annual consumption by the volume of compliant water produced can be more informative where an option has significant reject streams or downtime, provided all options use the same definition.
A credible supplier submission should make the energy estimate traceable to a defined operating case. The supporting information should identify:
- Feed conditions: design and expected flows, pollutant loads, temperature, and relevant variability.
- Required output: discharge or reuse quality, expected treated-water volume, and any recovery requirement.
- Included loads: blowers, pumps, mixers, controls, cleaning systems, sludge handling, and other auxiliaries within the proposed boundary.
- Operating assumptions: annual hours, average and peak loads, standby equipment, fouling allowances, and cleaning frequency.
- Utilities: electricity, fuel, steam, or externally supplied heat, with their quantities stated separately.
Annual estimates should reflect the expected distribution of operating conditions, rather than multiplying a single favorable power reading by annual hours. For a variable-flow plant, it can be useful to price several load bands separately. For an industrial site with production shutdowns, the model should account for minimum operating loads, standby consumption, and the energy needed to restart or maintain biological treatment.
Care is also needed with heat and power recovery claims. Biogas generated from anaerobic digestion may offset purchased energy where gas production, conversion efficiency, operating availability, and usable heat demand support the estimate. The model should deduct parasitic loads and include the equipment and maintenance costs required to realize that benefit. Gross energy production is not the same as a reduction in the utility bill.
Test the assumptions that can change the decision
A single forecast can conceal how sensitive the investment is to uncertain conditions. Electricity price, plant utilization, influent loading, membrane replacement intervals, and disposal charges are particularly important where they differ substantially between proposals.
For the illustrative systems above, an electricity rate of $0.10 per kWh would reduce the annual energy saving to $20,000, producing a nine-year simple payback before other costs. At $0.20 per kWh, the saving would be $40,000 and the simple payback 4.5 years. Neither rate is a forecast; the calculation shows why the assumed tariff can change the preferred option.
Utilization deserves the same attention. A system selected for future expansion may spend years operating well below its design capacity. If a supplier’s energy guarantee applies only at full load, it may reveal little about the period that determines the investment return. Ask for power estimates at the expected initial duty as well as at later design capacity, and examine whether modular equipment or effective turndown changes the economics.
Carbon costs should be included where they create an identifiable financial exposure, such as an applicable charge or a contractual requirement to purchase eligible instruments. Avoid adding a hypothetical carbon price to the base case without stating the assumption. If carbon risk matters to the investment decision, show it as a separate scenario and avoid double counting costs already embedded in the electricity tariff.
Turn energy estimates into enforceable procurement terms
An energy-efficient design offers limited financial certainty if the quoted consumption is not tied to a defined test. Tender documents can require suppliers to state guaranteed or committed power consumption at specified flows, influent conditions, and effluent quality. The test boundary should identify which equipment and auxiliary loads are measured, whether readings are taken at electrical input or equipment output, and how deviations from test conditions are handled.
Performance testing also needs a practical acceptance method. A short test at clean conditions may confirm equipment operation but may not demonstrate long-term fouling, seasonal loading, or annual energy consumption. Where a full-year demonstration is impractical, the contract can distinguish between a measurable acceptance test and longer-term operating assumptions used in the lifecycle model. Responsibilities for calibration, data collection, corrective action, and any remedies should be clear.
Finally, efficiency depends on maintainable performance. The cost model should include access to replacement membranes, diffusers, instruments, and controls; scheduled maintenance; and the consequences of equipment downtime. A marginally lower calculated energy bill is not persuasive if it depends on operating conditions the site cannot maintain or excludes essential support costs. The strongest investment case is the one that remains competitive when its energy assumptions are made explicit and tested against the plant’s expected operation.
Recommended News
How to find verified providers in an industrial environmental solutions directory
Use an environmental solutions directory for industry to find verified providers, compare technical capabilities and costs, and build a reliable supplier shortlist.
How to identify applicable water reuse equipment standards
Identify applicable water reuse equipment standards with a practical guide to regulations, performance claims, certification, and monitoring.

How to measure resource recovery efficiency in e-waste refining
Learn how to measure resource recovery efficiency in e-waste refining with metal balances, sampling and verified yields. Compare technologies with confidence.
How to evaluate a ZLD system integrator’s project experience
Evaluate a ZLD system integrator with confidence. Learn how to verify relevant projects, operating results and contract risks before selecting a partner.
How VOC concentration affects industrial VOC treatment selection
Explore how VOC concentration shapes industrial VOC treatment selection, from adsorption and oxidation to solvent recovery. Find the right approach for your process.
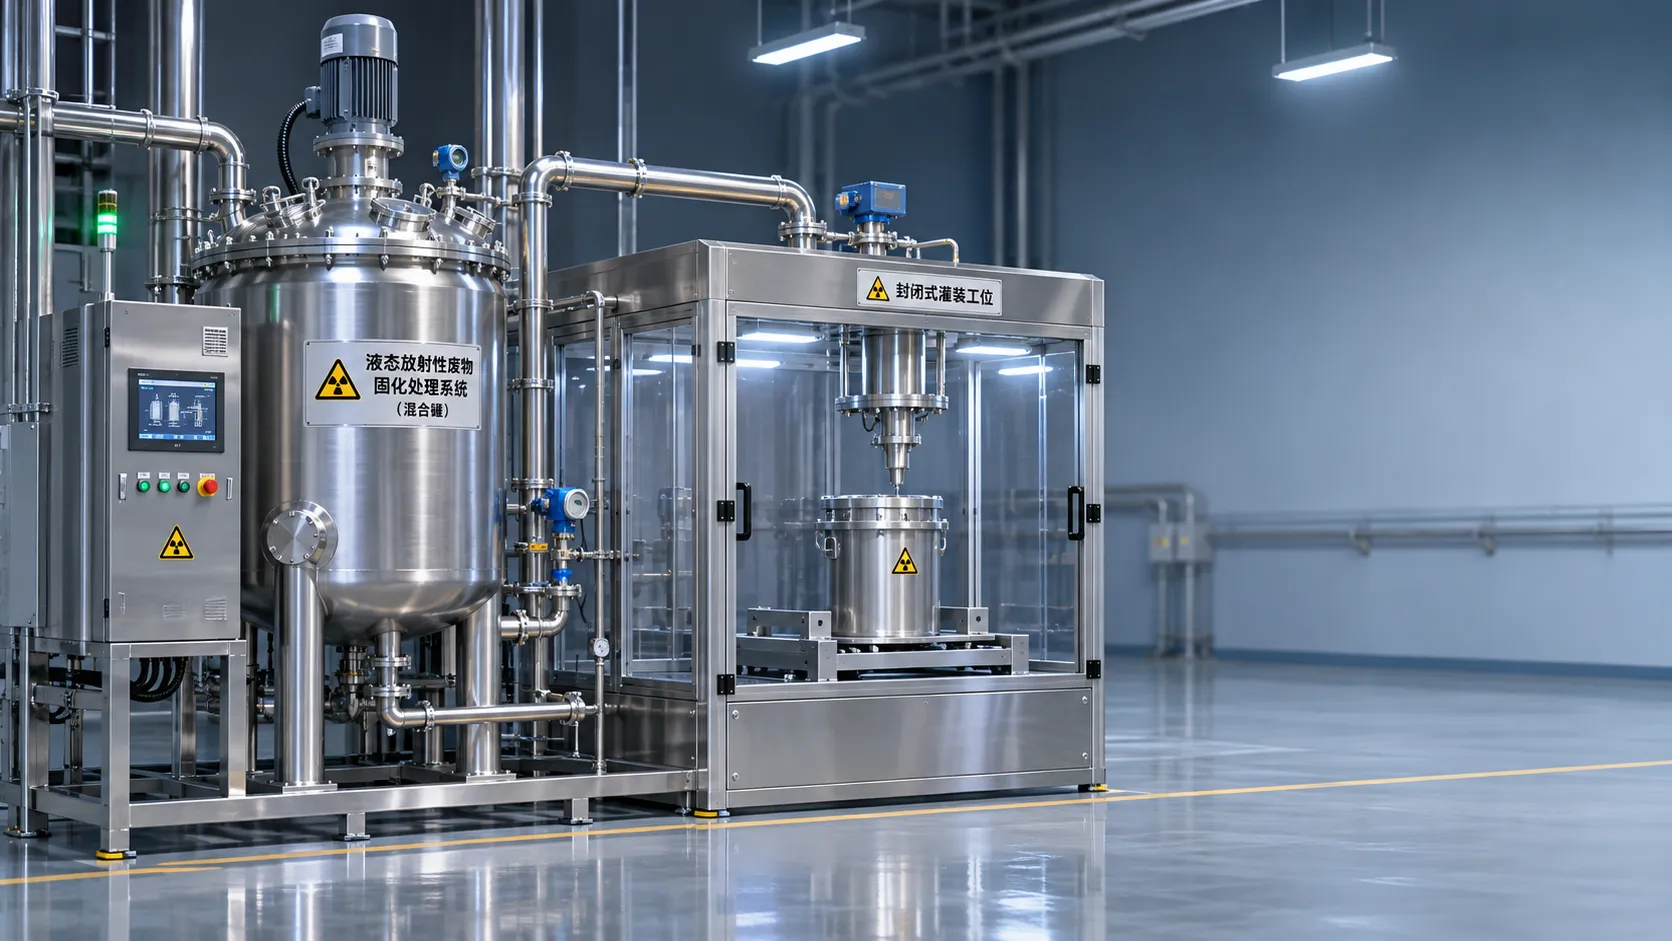
How to select nuclear waste safety equipment for liquid solidification
Choose nuclear waste safety equipment for liquid solidification with confidence. Compare waste acceptance, containment, radiation protection, and lifecycle costs.
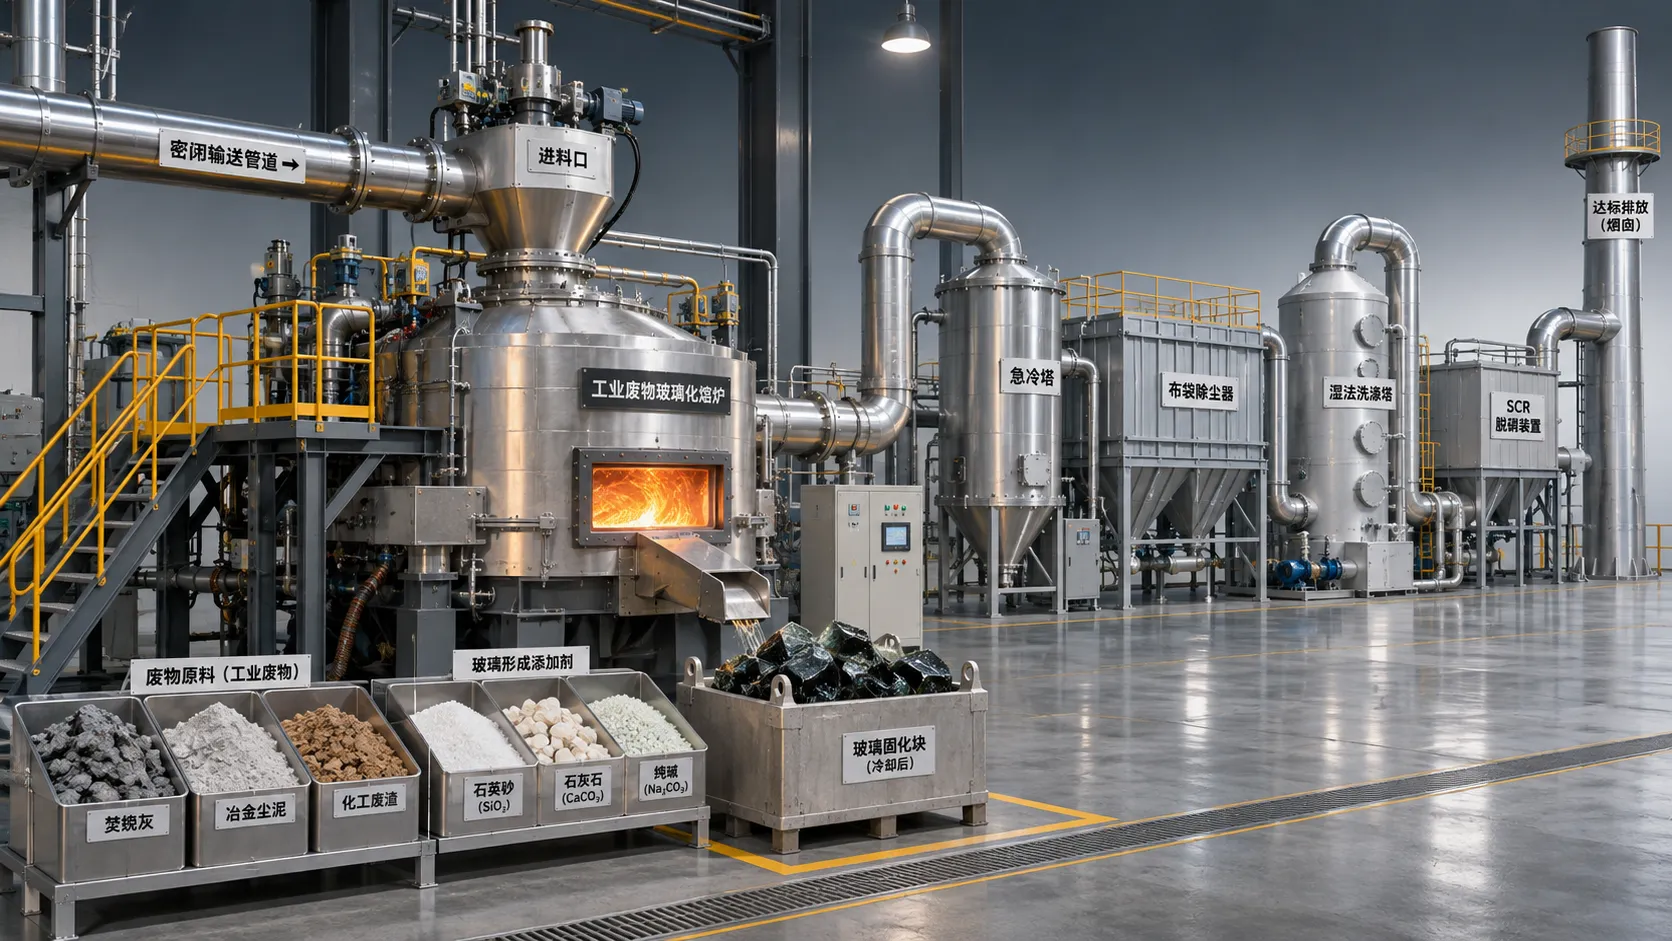
How does waste composition affect waste vitrification cost?
Discover how moisture, glass chemistry and contaminants affect waste vitrification cost—and learn how to compare bids and avoid hidden expenses.
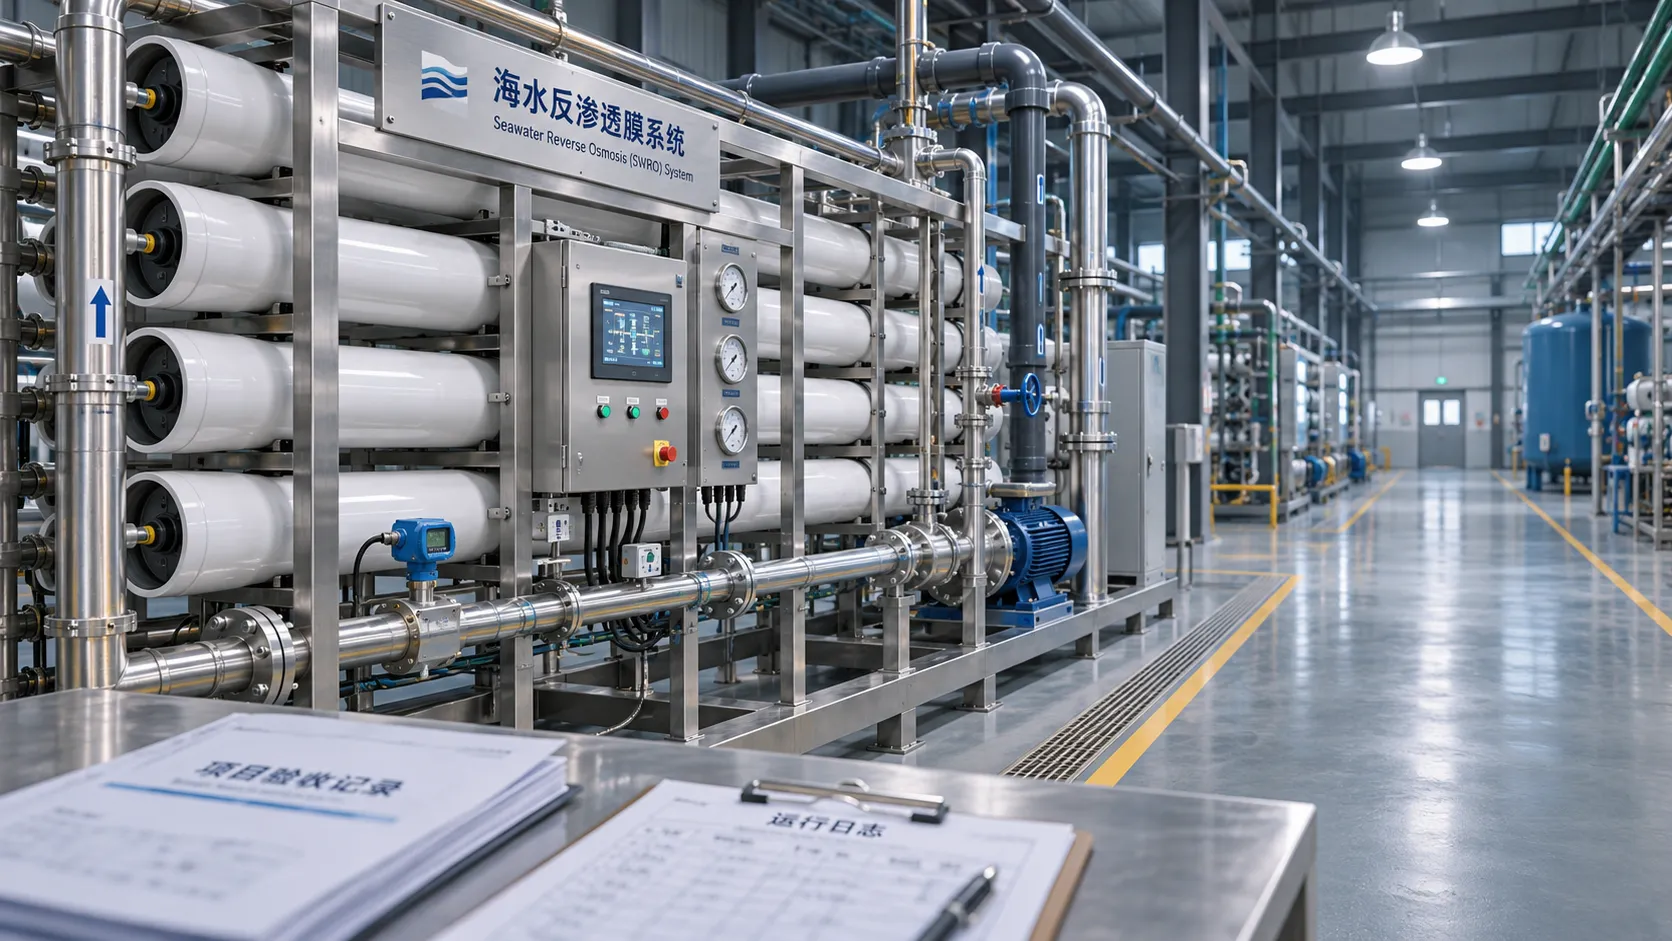
How to verify an SWRO membrane systems exporter's track record
Verify an SWRO membrane systems exporter's track record with practical checks for project references, operating evidence, export capability and after-sales support.
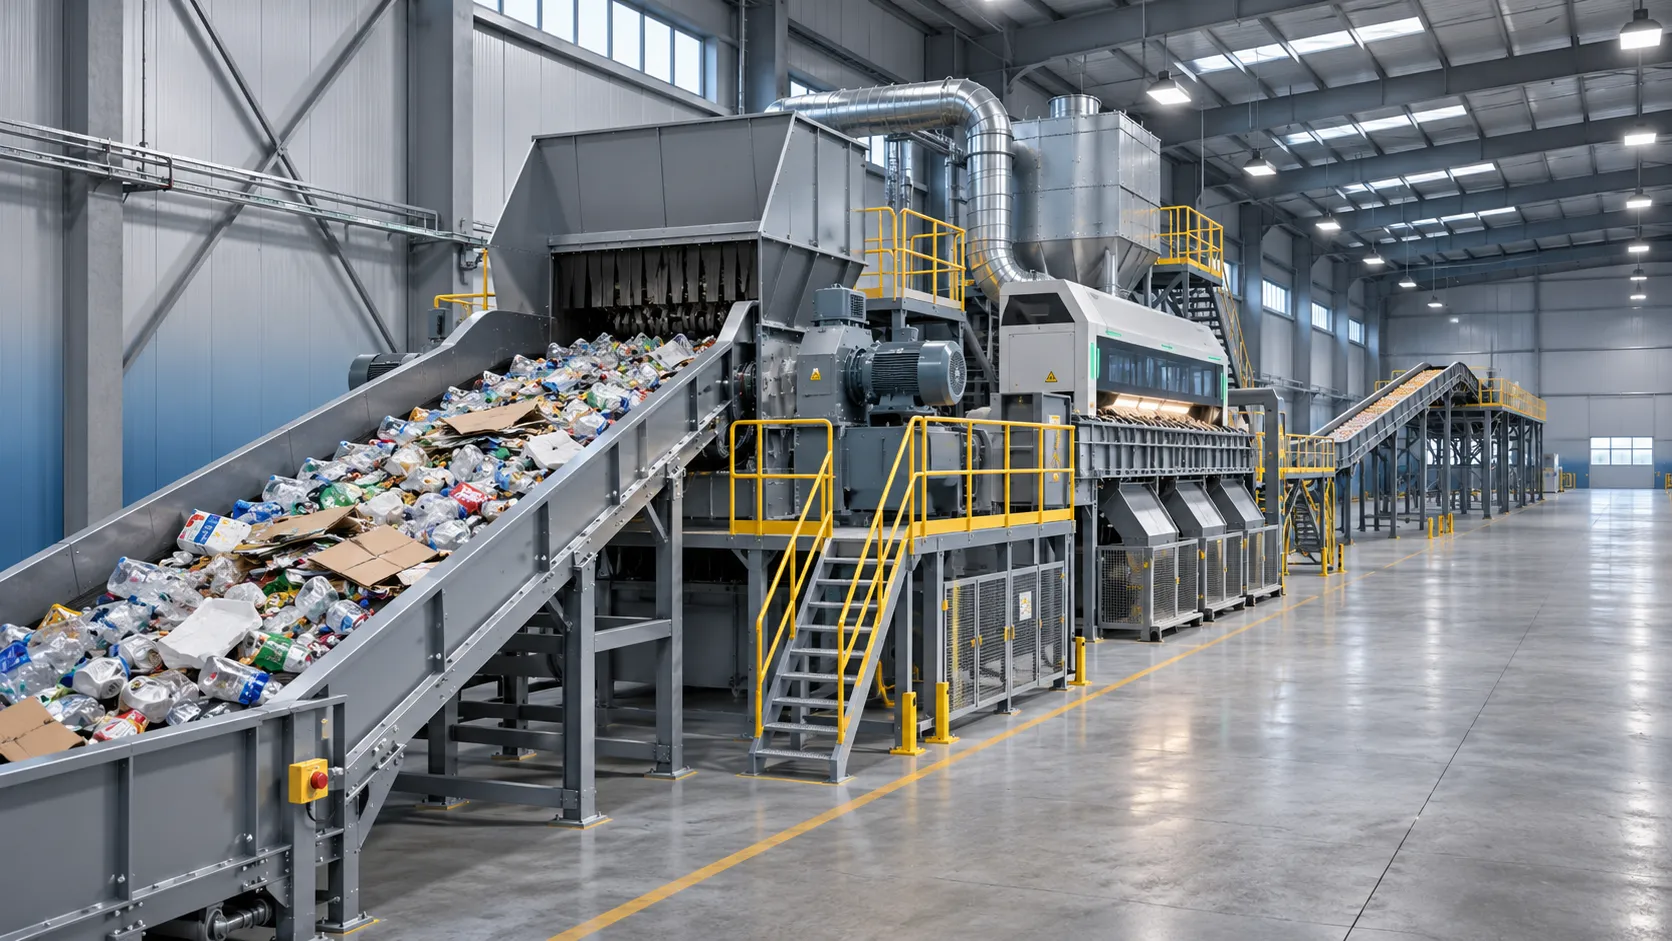
How does capacity affect waste recovery equipment price?
Discover how capacity affects waste recovery equipment price, and learn how to compare throughput, operating costs, and supplier quotes for a smarter investment.