
Industry News
Curation by industry experts
Hot Articles
Popular Tags
How to set recovery rates in seawater reverse osmosis system design
Setting recovery too high can turn a seawater reverse osmosis design into an energy-intensive, scaling-prone liability. Setting it too low increases the seawater volume that must be abstracted, screened, and pretreated for each cubic meter of product water. The difficult question is not how much water a membrane can extract under favorable conditions, but how much the plant can reliably deliver throughout its operating year.
For technical evaluators, seawater desalination systems engineering therefore requires more than selecting a conventional percentage. A defensible recovery target connects feedwater chemistry, membrane hydraulics, product quality, energy recovery, and discharge compliance. It should emerge from a documented operating envelope—not appear as an unexplained assumption in the process datasheet.
Define the recovery boundary before comparing designs
Recovery is the fraction of feedwater converted into permeate across a specified process boundary. For a single SWRO membrane array:
Array recovery, R = Qp / Qf
Here, Qp is permeate flow and Qf is feed flow entering that array. Concentrate flow is Qb = Qf − Qp. All flows must use a consistent measurement basis.
Overall plant recovery is different. It compares net exported product water with raw seawater intake over the same accounting period. Pretreatment backwash, membrane flushing, second-pass reject, off-spec diversion, and other internal water uses can all affect that figure. Recycles must be represented explicitly; adding internal circulation to the intake denominator distorts the result.
A second RO pass also needs careful treatment. Its feed is first-pass permeate, not seawater. Without recycle, the combined membrane recovery is the product of the two pass recoveries. With reject recycle, a complete steady-state mass balance is necessary.
Before evaluating any recovery claim, ask which streams and operating losses it includes. Two proposals with identical first-pass recovery may deliver different net water yields.
Use conventional ranges as screening values, not design rules
Many conventional single-pass SWRO designs operate at approximately 35–50% recovery. This is an orientation range, not a universal recommendation or a regulatory requirement. Specialized configurations can operate outside it, while difficult feedwaters may justify a more conservative target.
Feed salinity is an immediate discriminator. Open-ocean seawater and highly saline coastal water do not impose the same osmotic load. Temperature, ionic composition, intake quality, membrane selection, and discharge conditions can shift the feasible recovery even where total dissolved solids appear similar.
Rather than beginning with “the plant will run at 45%,” evaluate several candidate recoveries and identify the constraint that binds at each one. The most useful design comparison shows why an additional percentage point becomes unattractive or unacceptable.
Translate recovery into concentrate conditions
A simple salt balance provides an early warning of how strongly recovery changes the concentrate:
Cb = (QfCf − QpCp) / Qb
Cf, Cp, and Cb represent feed, permeate, and concentrate salt concentrations. For preliminary screening, when permeate salt concentration is small relative to feed concentration:
Cb ≈ Cf / (1 − R)
These are illustrative bulk-stream estimates, not membrane-surface concentrations or complete chemical predictions. Detailed calculations should use a consistent mass or volumetric basis, account for density where material, and retain permeate salt passage.
The membrane surface experiences higher concentrations than the bulk stream because of concentration polarization. Consequently, a bulk concentrate analysis that appears acceptable does not establish that the final membrane elements will remain scale-free.
Check precipitation risk using actual ionic chemistry
Total dissolved solids alone cannot establish scaling limits. Evaluate calcium carbonate, calcium sulfate, barium sulfate, strontium sulfate, silica, and other relevant constituents using representative feed analyses. Include pH, alkalinity, temperature, and the chemical changes introduced by pretreatment.
At seawater and concentrate ionic strengths, use calculation methods appropriate for saline solutions. A simple freshwater scaling index is not an adequate standalone basis for approving elevated SWRO recovery.
Antiscalant selection and dosing should be supported by a supplier assessment for the proposed chemistry and operating conditions. Antiscalant does not remove the underlying salts, and increasing its dose cannot justify arbitrary supersaturation. Where uncertainty remains, retain margin or obtain additional testing.
Pressure, flux, and water quality set interacting limits
As recovery increases, salinity rises along the pressure vessel and the available net driving pressure falls. A simplified relationship is:
Water flux ≈ membrane water permeability × (transmembrane pressure difference − osmotic pressure difference)
This explains why recovery cannot be assessed independently of pressure. Higher recovery may require greater feed pressure, a different membrane arrangement, lower production, or some combination of these measures.
Run manufacturer membrane projections for each candidate design, then inspect element-level results rather than accepting only the train summary. Confirm:
- Maximum operating pressure and pressure-vessel ratings.
- Lead-element flux and its implications for fouling exposure.
- Minimum concentrate flow and feed-channel hydraulic limits.
- Pressure drop across elements and vessels.
- Tail-element flux, concentrate chemistry, and predicted scaling conditions.
- Permeate salinity and boron performance under the required operating scenarios.
Recovery and flux are related but not interchangeable. Adding membrane area can reduce average flux at a given production rate, yet it does not automatically resolve the concentrated brine chemistry associated with a high recovery target.
Test seasonal corners, not just annual averages
Cold seawater reduces membrane permeability, which can make pressure capacity the limiting factor. Warmer seawater generally improves permeability but can increase salt passage; boron performance may also become more demanding. Higher salinity raises osmotic pressure and further compresses the operating margin.
Evaluate credible combinations of temperature, salinity, feed quality, membrane aging, and fouling allowance. Avoid combining unrelated extremes into an impossible scenario, but do not let a comfortable annual-average projection conceal a realistic seasonal failure.
Compare energy at the plant boundary
A common shortcut assumes that increasing recovery must reduce energy because less seawater is processed. Another assumes that lower recovery must reduce energy because membrane pressure is lower. Neither conclusion is reliable without a hydraulic and electrical model.
Modern pressure-exchanger energy recovery devices recover much of the hydraulic energy in the concentrate. Changing recovery changes the concentrate flow available to that device, the high-pressure pumping arrangement, booster duty, and equipment operating points.
For seawater desalination systems engineering, compare specific energy consumption per cubic meter of net exported water. Include intake, pretreatment, high-pressure and booster pumps, energy recovery losses, second-pass treatment where applicable, and relevant auxiliary loads. State whether product distribution pumping is included.
Use actual pump and energy recovery device performance curves. A nominal efficiency at one design point can misrepresent seasonal operation and turndown. The preferred recovery may sit near a broad energy minimum rather than at the maximum technically achievable yield.
A worked comparison: what higher recovery changes
Consider an illustrative first-pass array producing 10,000 m³/day of permeate from seawater containing 35 g/L TDS. Ignoring minor losses and permeate salinity for this screening calculation:
The higher-recovery option reduces membrane feed demand by 20% and concentrate flow by one-third. Those differences can materially affect intake, pretreatment, and outfall sizing.
However, they do not demonstrate lower total cost. The 50% case also has higher concentrate salinity and osmotic pressure. Its value depends on required pressure, membrane area, chemical control, cleaning frequency, equipment efficiency, and environmental constraints. Raw intake demand will exceed the tabulated array feed if pretreatment and other losses are supplied from the intake.
This is the essential trade-off: higher recovery reduces the volume handled upstream while intensifying conditions at the membrane tail and in the discharge.
Let the discharge permit constrain the design early
A smaller brine stream is not automatically an easier discharge. Higher recovery produces more concentrated brine, while the salt load remains broadly tied to the seawater processed and salt retained. Receiving-water effects depend on concentration, flow, density, mixing, currents, bathymetry, and diffuser design.
Evaluate the applicable mixing-zone requirements, salinity limits, chemical residuals, and seasonal ecological sensitivities before freezing recovery. Lower discharge momentum at reduced flow may also change diffuser performance.
Where brine enters a shared outfall, evaporation system, or resource-recovery process, model the combined boundary. Higher SWRO recovery may reduce downstream hydraulic load without eliminating salt disposal obligations. SWRO alone should not be presented as a zero-liquid-discharge solution.
Specify an operating envelope and the evidence behind it
No single generally applicable standard prescribes the correct recovery percentage for every seawater RO plant. The design must satisfy the project's water-quality requirements, applicable environmental permits, equipment ratings, and membrane supplier limits. Identify the relevant documents and editions in the design basis rather than treating a customary recovery value as a compliance criterion.
A technically reviewable submission should contain:
- A feedwater basis: seasonal chemistry, temperature and salinity ranges, sampling history, and unresolved uncertainties.
- Closed balances: water and salt balances covering pretreatment losses, passes, recycles, flushing, and net export.
- Validated projections: membrane model inputs, element-level checks, scaling assessments, and aging assumptions.
- Comparable economics: energy, chemicals, membrane replacement, cleaning downtime, intake capacity, and discharge costs on consistent boundaries.
- Operating controls: normal recovery, permitted adjustment range, limiting conditions, alarm thresholds, and corrective actions.
Commissioning should confirm actual flows, conductivity, temperature, pressure, differential pressure, and product quality against the design assumptions. Trending normalized membrane performance helps distinguish seasonal effects from fouling or deterioration. Recovery changes should remain within the verified envelope rather than becoming an informal response to production pressure.
The strongest recovery decision is therefore not simply “45%” or “50%.” It states the target, the conditions under which that target is valid, the constraint that limits further increase, and the response when feedwater changes. That is what turns a percentage into an operable SWRO design.
Recommended News
When is compaction suitable for solid nuclear waste treatment?
Is compaction right for solid nuclear waste treatment? Discover suitable waste streams, key safety checks, and disposal requirements to reduce package volume and optimize costs.
How solids concentration affects dewatering in waste recovery systems
Optimize waste recovery systems dewatering with insights on solids concentration. Learn to balance throughput, cake dryness, and solids capture while avoiding costly equipment overloads.
How to compare technical specs in an environmental equipment directory
Use this environmental equipment directory technical guide to compare capacity, energy use, compliance, and supplier evidence. Build a defensible shortlist and choose with confidence.
How to assess a zero liquid discharge equipment supplier’s energy claims
Assess a zero liquid discharge equipment supplier’s energy claims. Learn how to verify system boundaries, compare real costs, and demand testable guarantees before you buy.
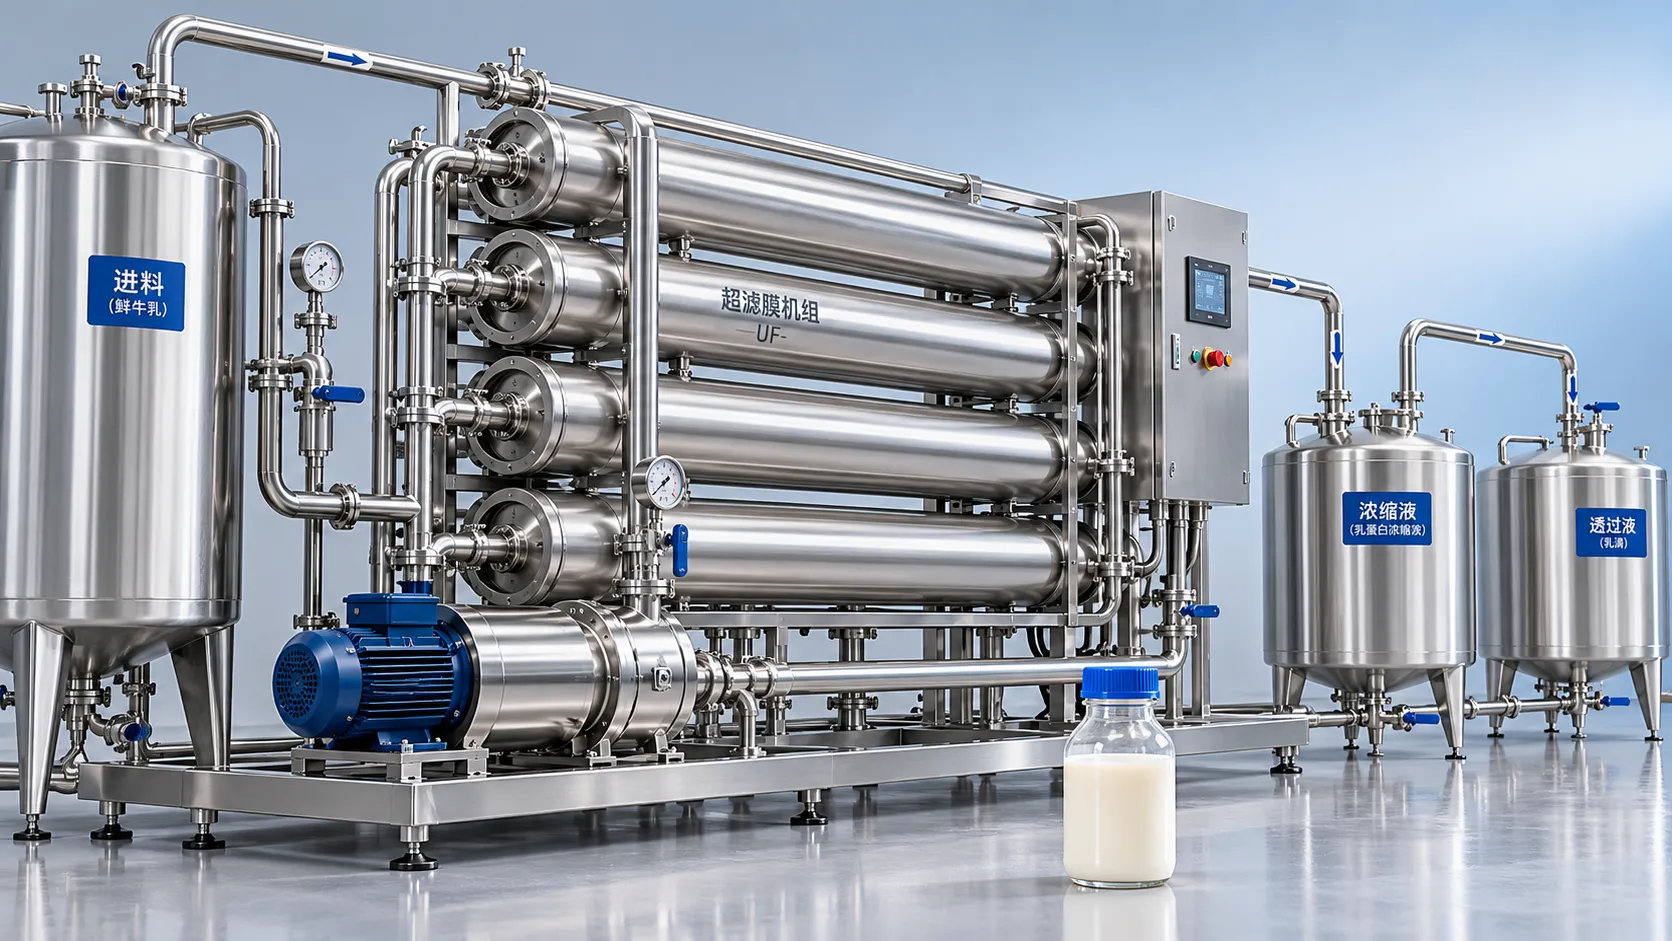
Which membrane filtration process suits dairy protein concentration?
Explore membrane filtration for dairy: compare UF, MF, and RO to select the right process for protein concentration, lactose reduction, and better recovery. Find your best fit.
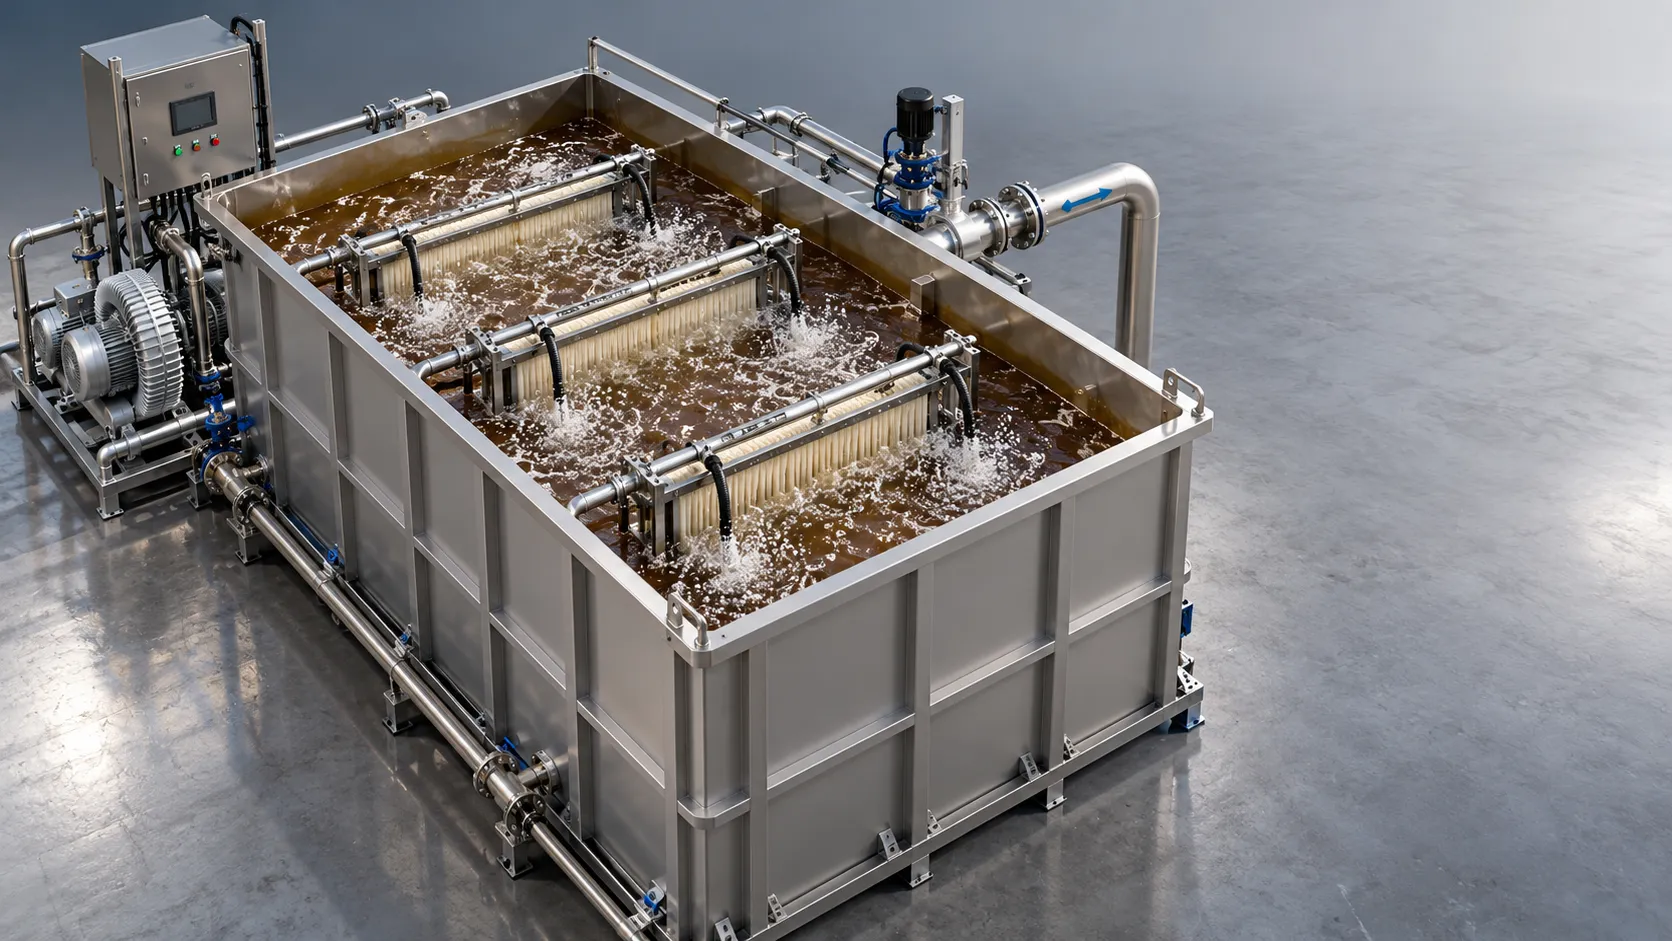
When is an MBR suitable for wastewater purification for bioprocessing?
For wastewater purification for bioprocessing, discover when an MBR fits your needs. Compare water quality, fouling risks, and lifecycle costs before investing.
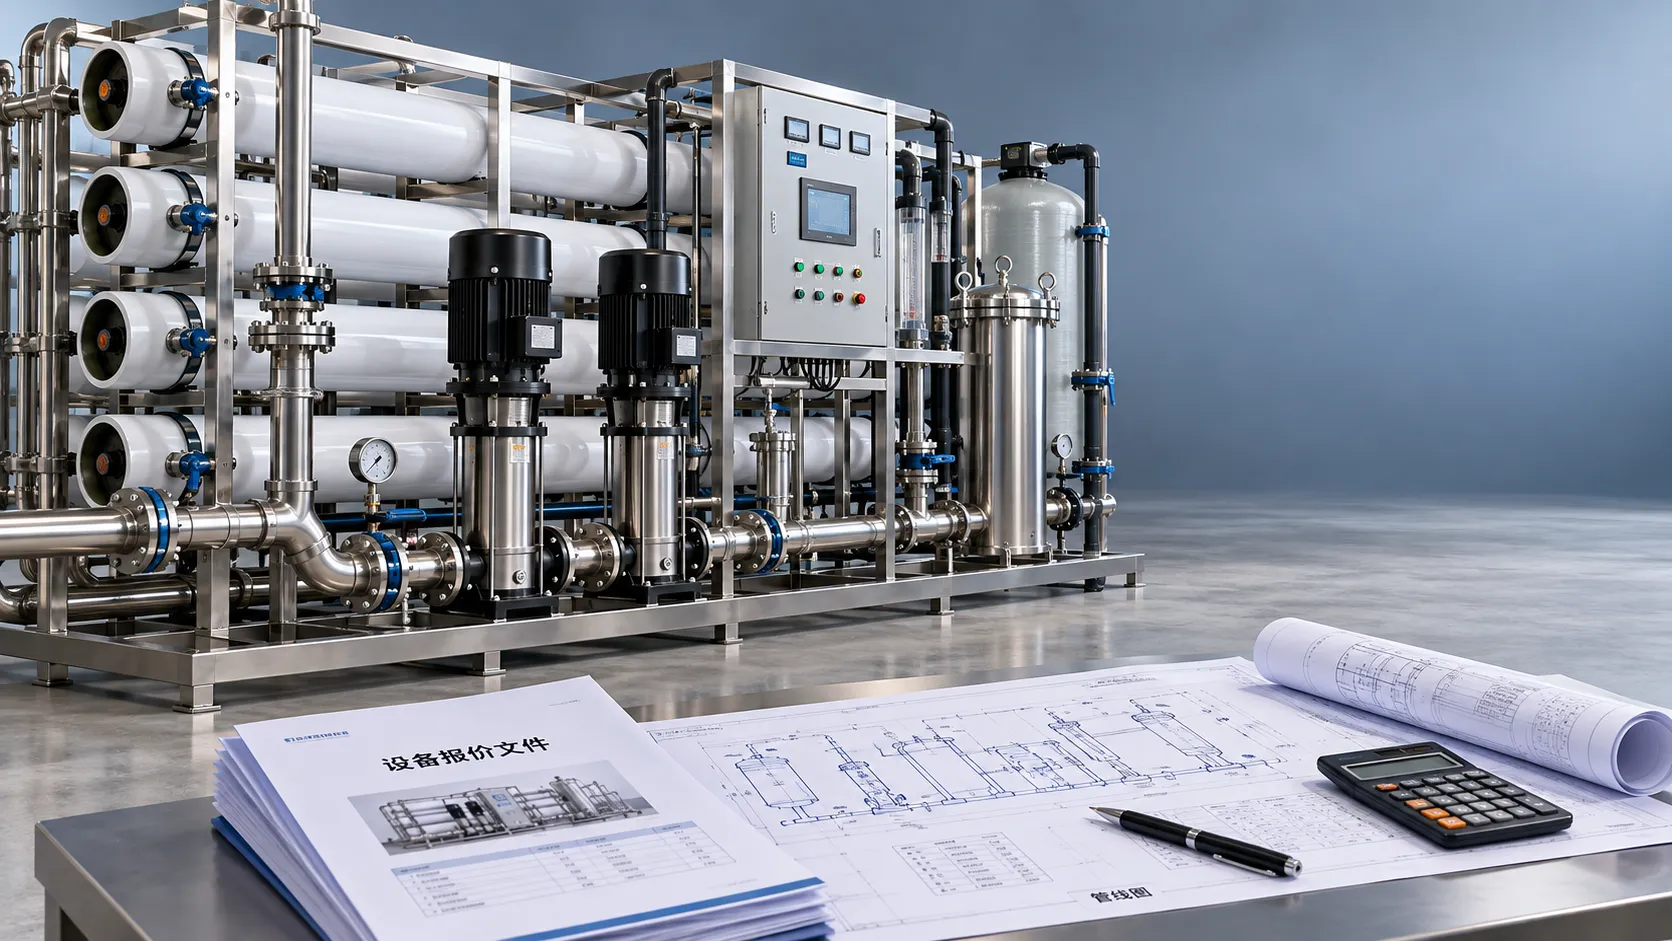
How to check a water treatment quotation for hidden project costs
Review your water treatment quotation for hidden costs, scope gaps, and operating expenses. Learn what to check before signing to protect your budget and avoid costly surprises.
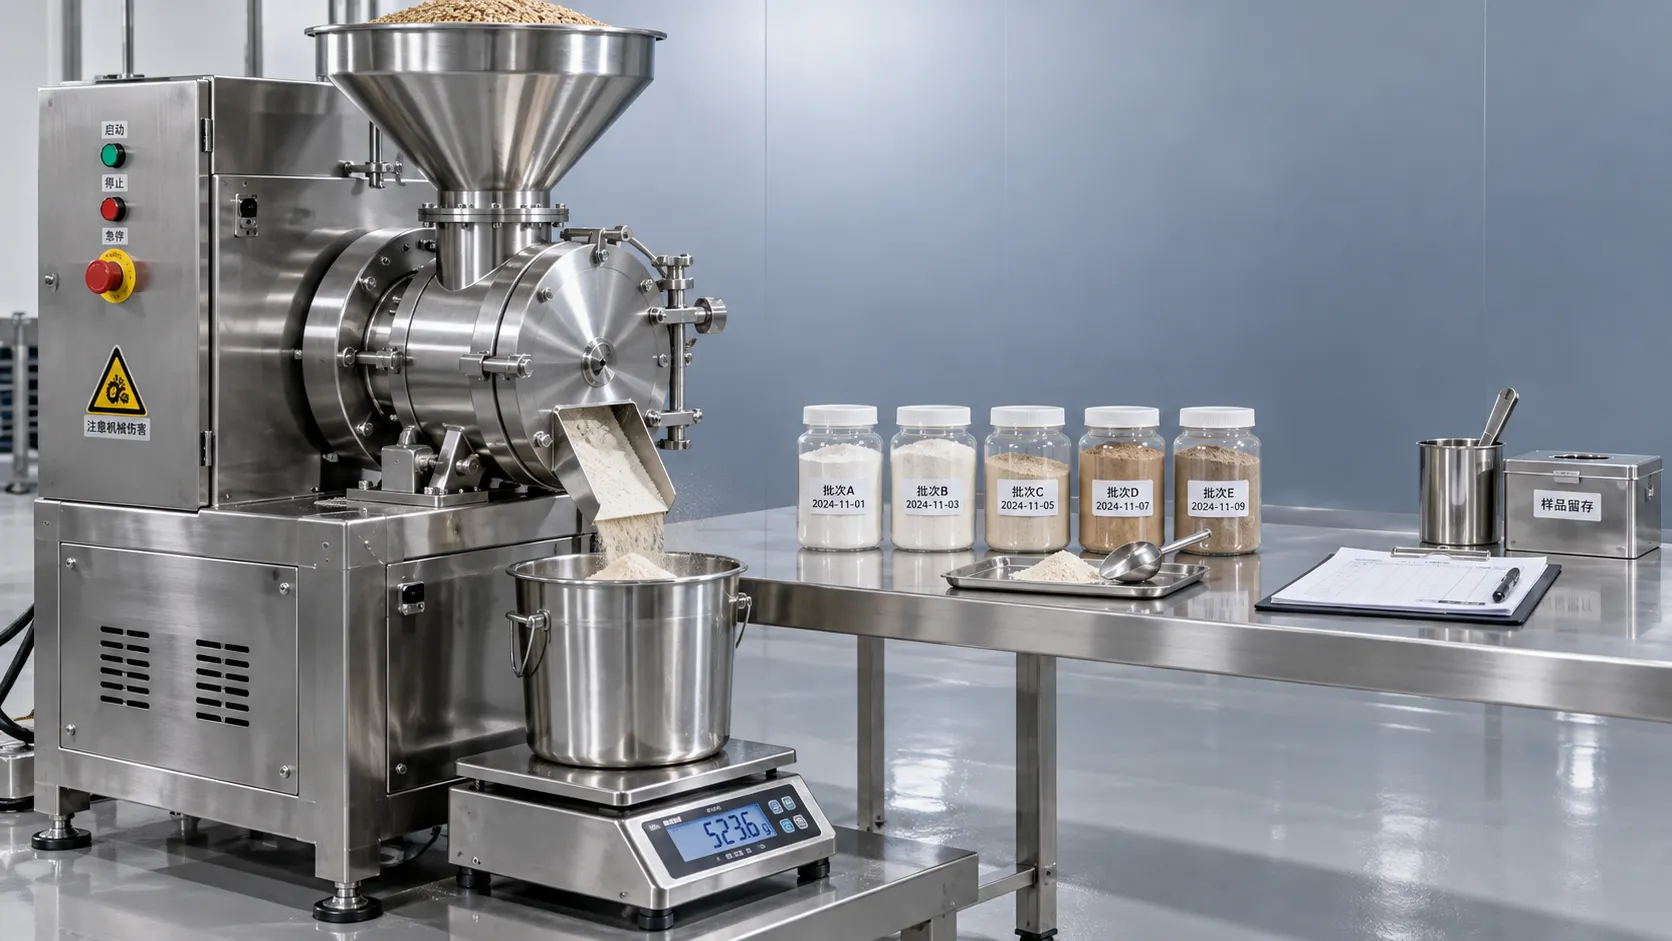
How to vet ingredient processing equipment manufacturers using trials
Vet ingredient processing equipment manufacturers with real-world trials. Learn how to verify yield, cleaning, energy use, and scale-up before you invest.
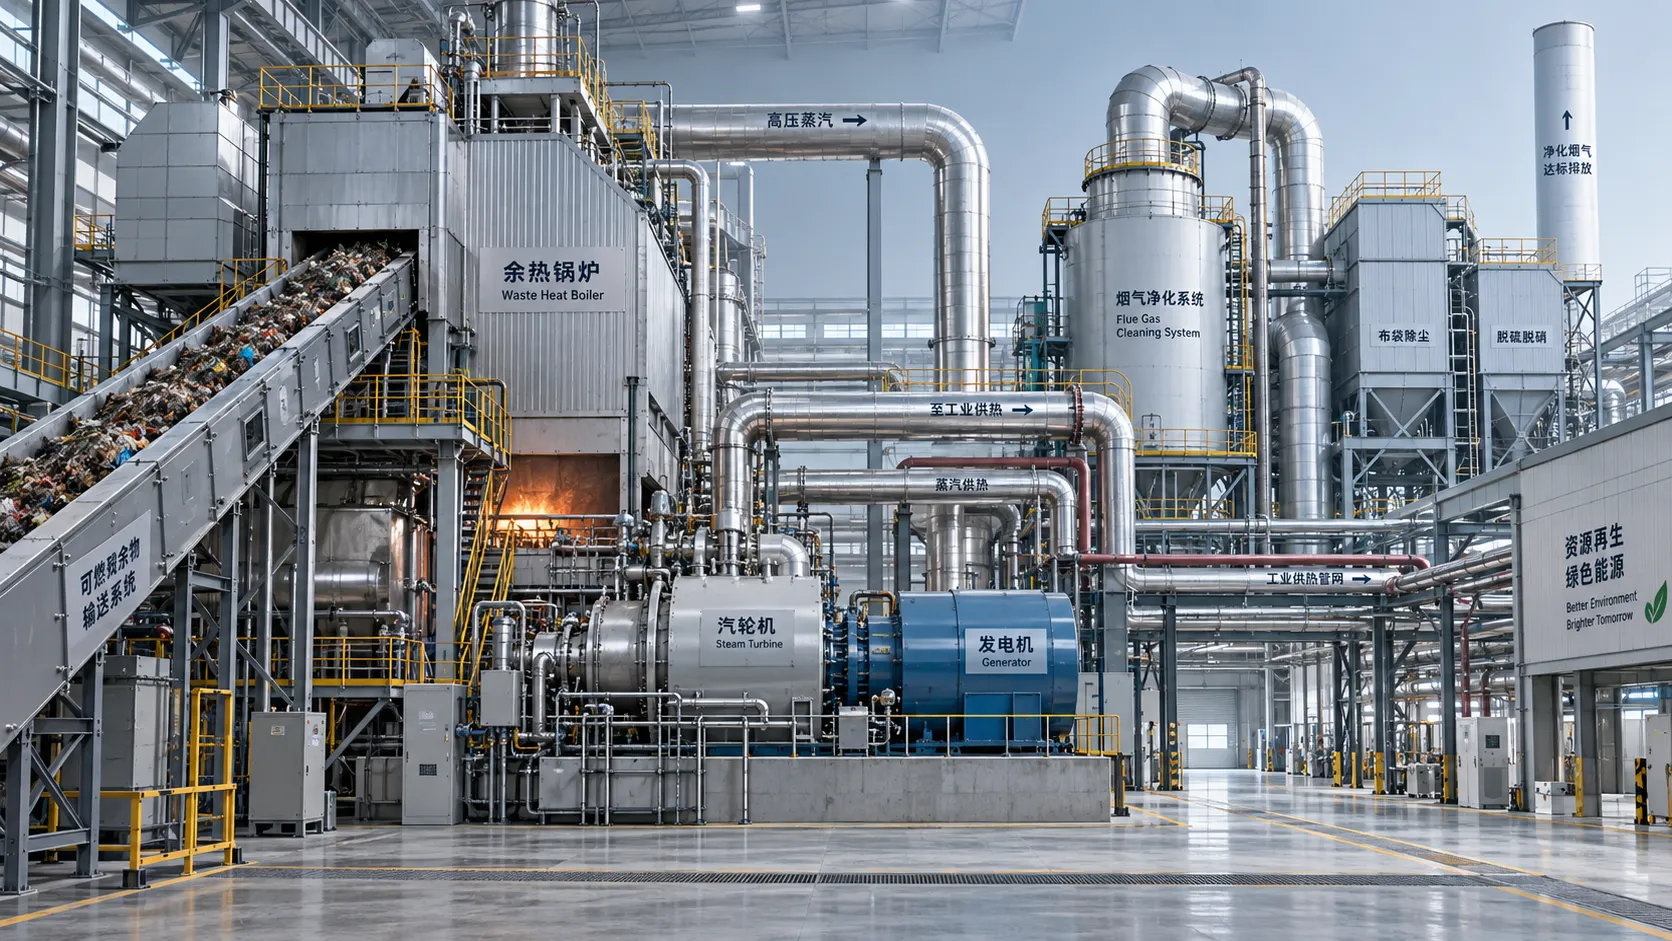
When is energy recovery viable in the solid waste recovery process?
When is energy recovery viable in the solid waste recovery process? Explore feedstock quality, net energy, emissions, and costs to assess feasibility and make smarter investment decisions.