
Industry News
Curation by industry experts
Hot Articles
Popular Tags
How to Evaluate AI Waste Sorting Throughput in Real Plant Conditions
Nameplate figures rarely tell the full story of AI waste sorting throughput. In operating plants, line performance shifts with feed variability, moisture, dirt, staffing rhythm, and maintenance discipline.
That makes throughput evaluation a technical issue, not a brochure exercise. It also matters beyond sorting alone, because recovery quality now affects compliance, carbon reporting, and the economics of circular resource systems.
Within the wider ecological engineering landscape tracked by ESD, AI sorting sits beside water treatment, flue gas control, desalination, and nuclear waste management as part of the same reliability question: how does equipment perform under real industrial stress?
What throughput really means on an AI sorting line
AI waste sorting throughput is often reduced to tons per hour. That metric matters, but it is incomplete when separated from purity, recovery rate, and uptime.
A line can process more mass by loosening recognition thresholds or increasing belt speed. If usable material recovery falls, practical throughput may actually decline.
In real plant conditions, throughput should be read as qualified throughput. That means the volume of waste processed while target fractions still meet downstream specifications.
For mixed municipal waste, packaging waste, and commercial dry recyclables, this distinction becomes critical. A faster line that produces unstable output can burden baling, reprocessing, or residue handling.
Why the industry is paying closer attention
The market no longer rewards volume alone. Recovery facilities are under pressure to prove material yield, reject control, energy efficiency, and traceable operating consistency.
Regulatory tightening also changes the discussion. Extended producer responsibility, landfill diversion targets, and carbon-related trade measures increase the value of verifiable plant data.
This is where AI waste sorting throughput becomes a strategic indicator. It connects sorting intelligence with plant profitability, contractual guarantees, and environmental governance performance.
For platforms such as ESD, that connection is familiar. Across environmental infrastructure, the core question is not maximum theoretical capacity, but stable output under fluctuating feed and strict compliance boundaries.
The operating variables that distort simple capacity claims
Real throughput changes because waste is not uniform. Even within one city, seasonal shifts can alter packaging density, film content, glass breakage, and food contamination.
Moisture is another hidden factor. Wet material affects sensor clarity, material separation behavior, and belt loading, especially in optical and robotic sorting stages.
The most common variables to document include:
- Feed composition by fraction, including paper, film, PET, HDPE, metals, organics, fines, and inert content
- Bulk density and layer depth on the conveyor
- Contamination rate within target materials
- Belt speed, spread quality, and burden uniformity
- Availability losses caused by cleaning, calibration, jams, and wear parts replacement
Without these context variables, AI waste sorting throughput data remains difficult to compare. Two plants can report the same tons per hour while producing very different commercial outcomes.
A practical framework for evaluating performance
A useful evaluation framework starts with system boundaries. Define whether throughput refers to the full line, a sorting cabin replacement module, one robotic cell, or an optical sorter stage.
Then separate four layers of performance. Each layer answers a different decision question.
This structure keeps AI waste sorting throughput from being overstated. It also aligns performance analysis with recovery economics rather than isolated machine speed.
How to build a credible field test
Short demonstrations can be useful, but they often flatter performance. A credible test window should include several shifts, mixed feed periods, and at least one maintenance interruption pattern.
Sampling should combine continuous operating data with manual composition checks. Sensor logs alone rarely explain why recovery changes.
Minimum field-test elements
- Baseline waste characterization before the AI stage
- Time-stamped belt loading and speed records
- Pick accuracy or ejection accuracy by target fraction
- Purity and recovery verification from output bunkers
- Downtime coding with cause categories
- Energy use and compressed air consumption where relevant
It is also worth separating startup, stabilized operation, and degraded operation. Many lines look excellent during the first hour and weaker by mid-shift when dust, vibration, and feed inconsistency accumulate.
Reading throughput together with quality
The best evaluations avoid a false choice between speed and quality. In practice, the two interact continuously.
If belt speed rises, object spacing narrows. That can reduce object recognition confidence, mis-pick rates, or air-jet timing precision, depending on the technology used.
For this reason, AI waste sorting throughput should be plotted against purity and capture rate, not reported in isolation. The useful question is where the performance curve starts bending downward.
That inflection point often defines the plant’s true operating window. It is more valuable than a single peak number from a controlled test run.
Typical plant scenarios that change the conclusion
Throughput evaluation should match the waste stream and plant role. Mixed waste front-end sorting is not judged the same way as high-purity packaging recovery.
Common scenarios
In municipal solid waste pre-sorting, stable removal of bulky contaminants may matter more than headline capture of one polymer fraction.
In material recovery facilities, the commercial value of PET, natural HDPE, and fiber makes qualified throughput a better benchmark than gross tons processed.
In industrial or commercial waste lines, product consistency may be high, but unexpected contaminants can create disproportionate downtime. Here, availability-adjusted AI waste sorting throughput becomes more meaningful.
Facilities connected to pyrolysis or chemical recycling need tighter contamination control. A line that moves more material but sends excess PVC or organics downstream may destroy process value.
Where evaluation often goes wrong
One common mistake is accepting supplier test conditions without checking representativeness. Clean, pre-spread material can produce misleadingly high AI waste sorting throughput figures.
Another mistake is ignoring maintenance behavior. Camera fouling, nozzle wear, gripper degradation, and calibration drift often decide real output after several months.
Data definitions also cause confusion. If one report uses scheduled hours and another uses running hours, throughput comparisons become distorted.
The same applies to residue accounting. Some systems shift material loss into rejects, which can make the sorting stage appear faster while masking lower recovery efficiency.
A stronger basis for decisions
A sound evaluation package should end with a decision matrix, not just test charts. That matrix should connect technical performance with operating cost, compliance exposure, and downstream revenue sensitivity.
Useful questions include whether AI waste sorting throughput remains stable across seasons, whether quality losses are recoverable elsewhere, and whether spare parts or software tuning depend heavily on vendor intervention.
This broader view fits the way ESD approaches environmental equipment intelligence. Reliable performance is rarely a standalone machine issue; it sits inside a larger chain of resource recovery, risk control, and infrastructure economics.
The next step is to build a plant-specific scorecard before comparing systems. Define feed conditions, required output quality, downtime rules, and value metrics first. Then test AI waste sorting throughput against those realities, not against generic capacity claims.
Recommended News
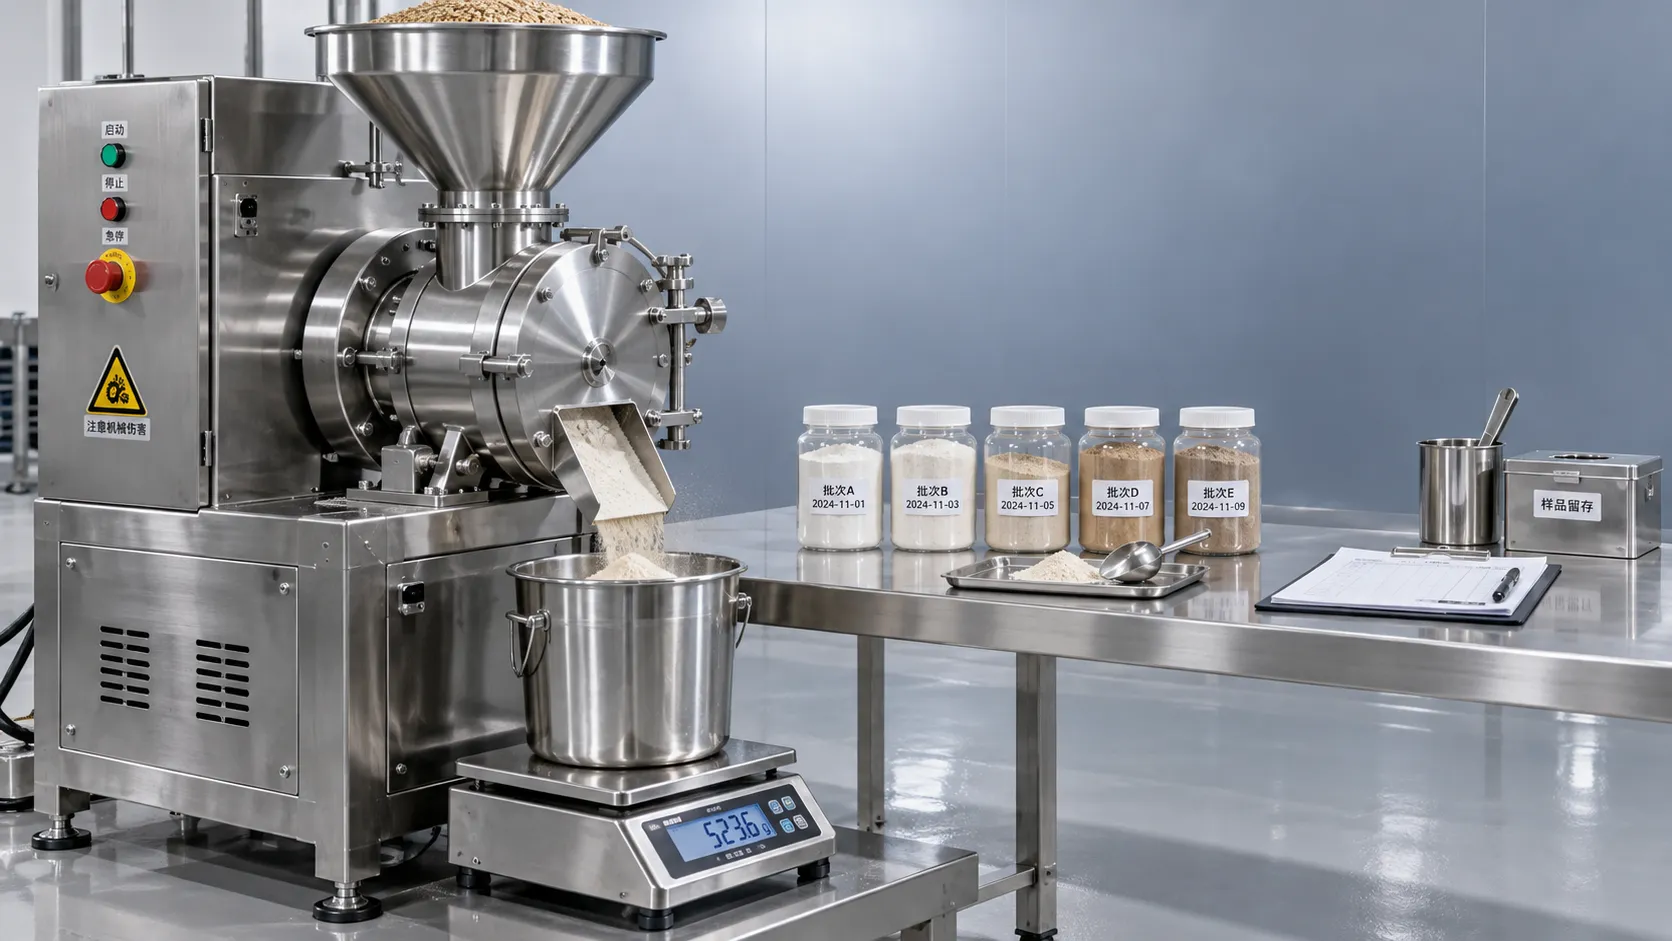
How to vet ingredient processing equipment manufacturers using trials
Vet ingredient processing equipment manufacturers with real-world trials. Learn how to verify yield, cleaning, energy use, and scale-up before you invest.
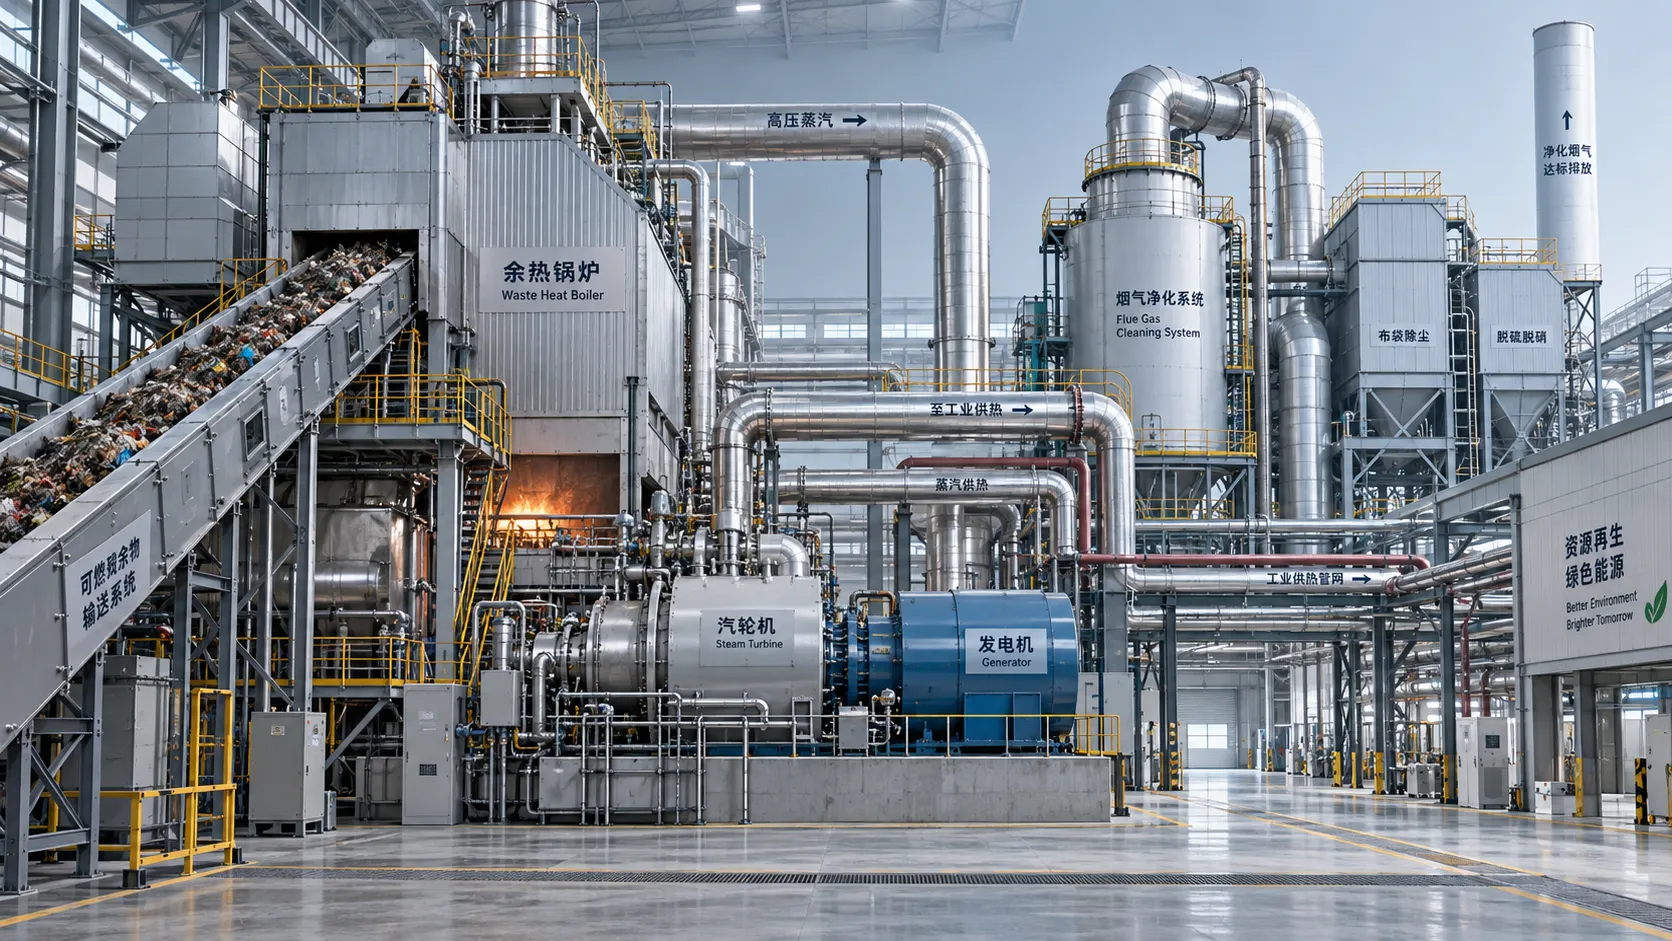
When is energy recovery viable in the solid waste recovery process?
When is energy recovery viable in the solid waste recovery process? Explore feedstock quality, net energy, emissions, and costs to assess feasibility and make smarter investment decisions.
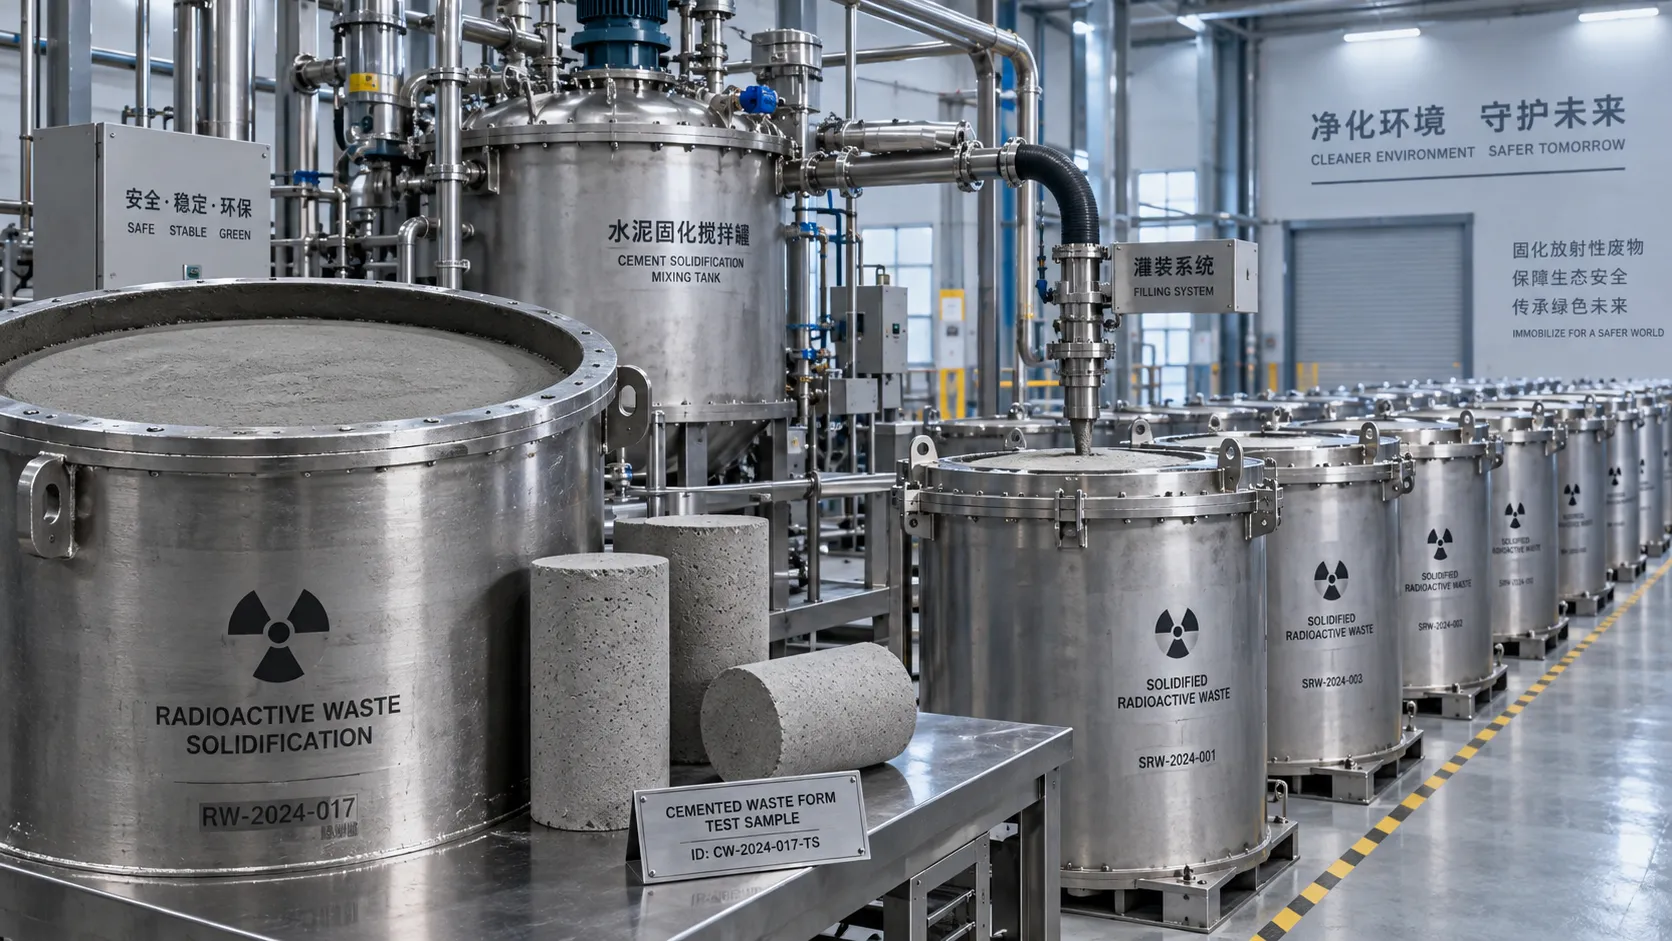
When is cementation suitable for nuclear decommissioning waste?
Explore nuclear waste treatment technology for decommissioning: learn when cementation fits, which risks to assess, and how disposal criteria guide an effective treatment choice.
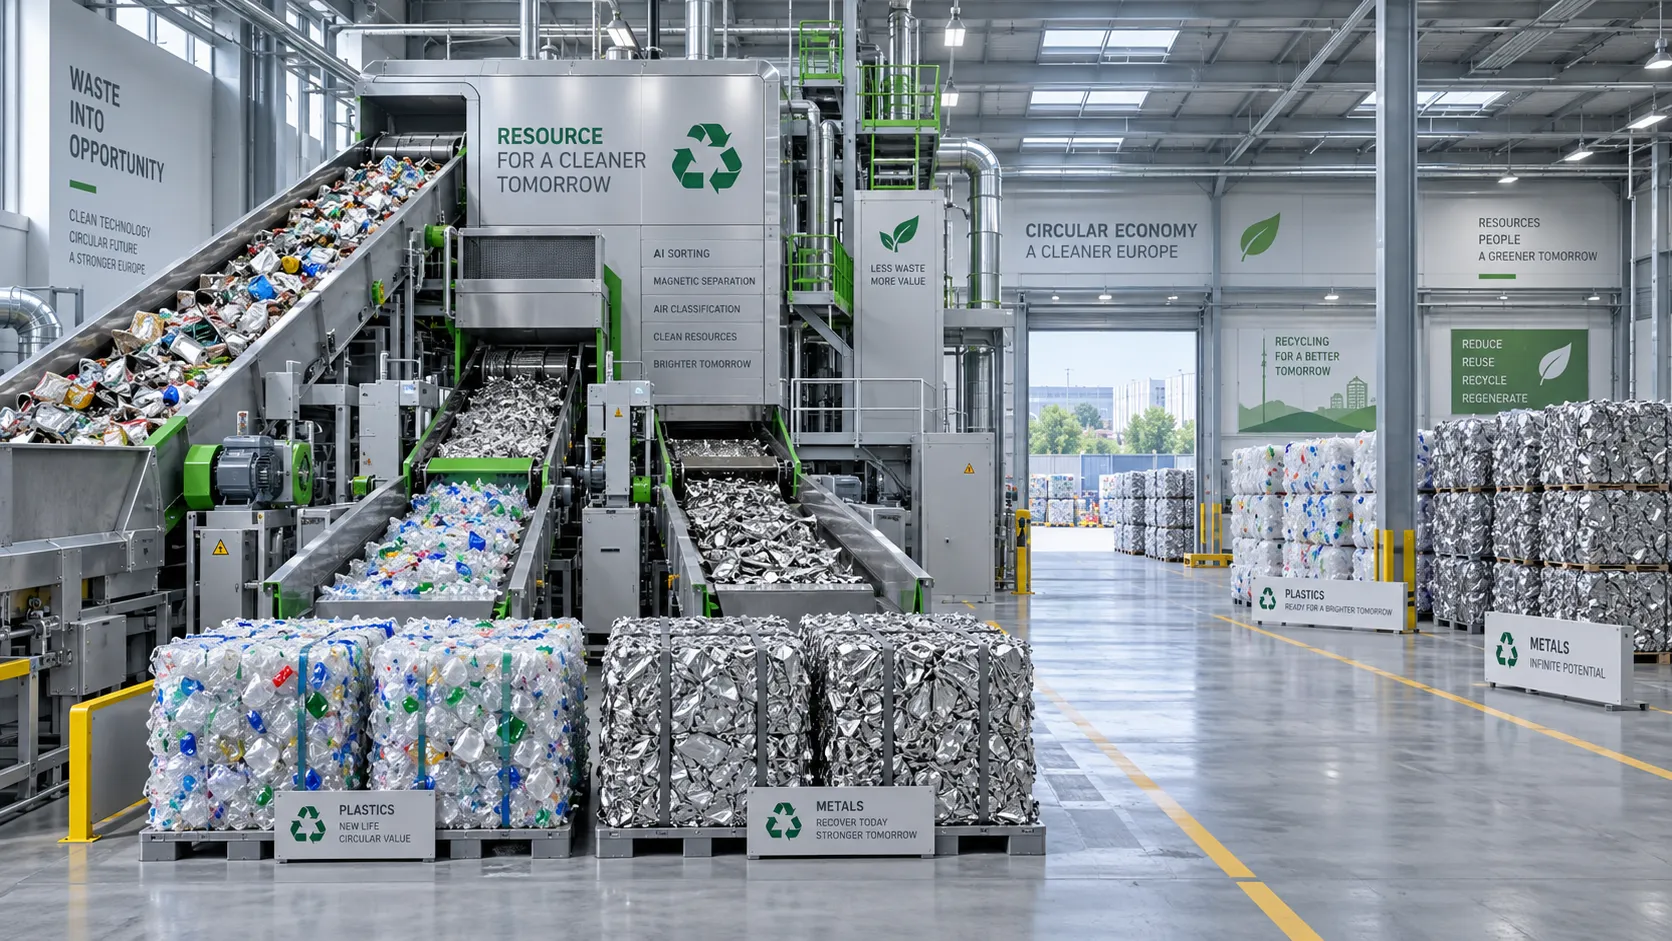
What determines payback for waste-to-resource systems in Europe?
Assess waste-to-resource systems Europe-wide: compare feedstock, recovery yields, costs and contracts to uncover payback drivers and make smarter investment decisions.
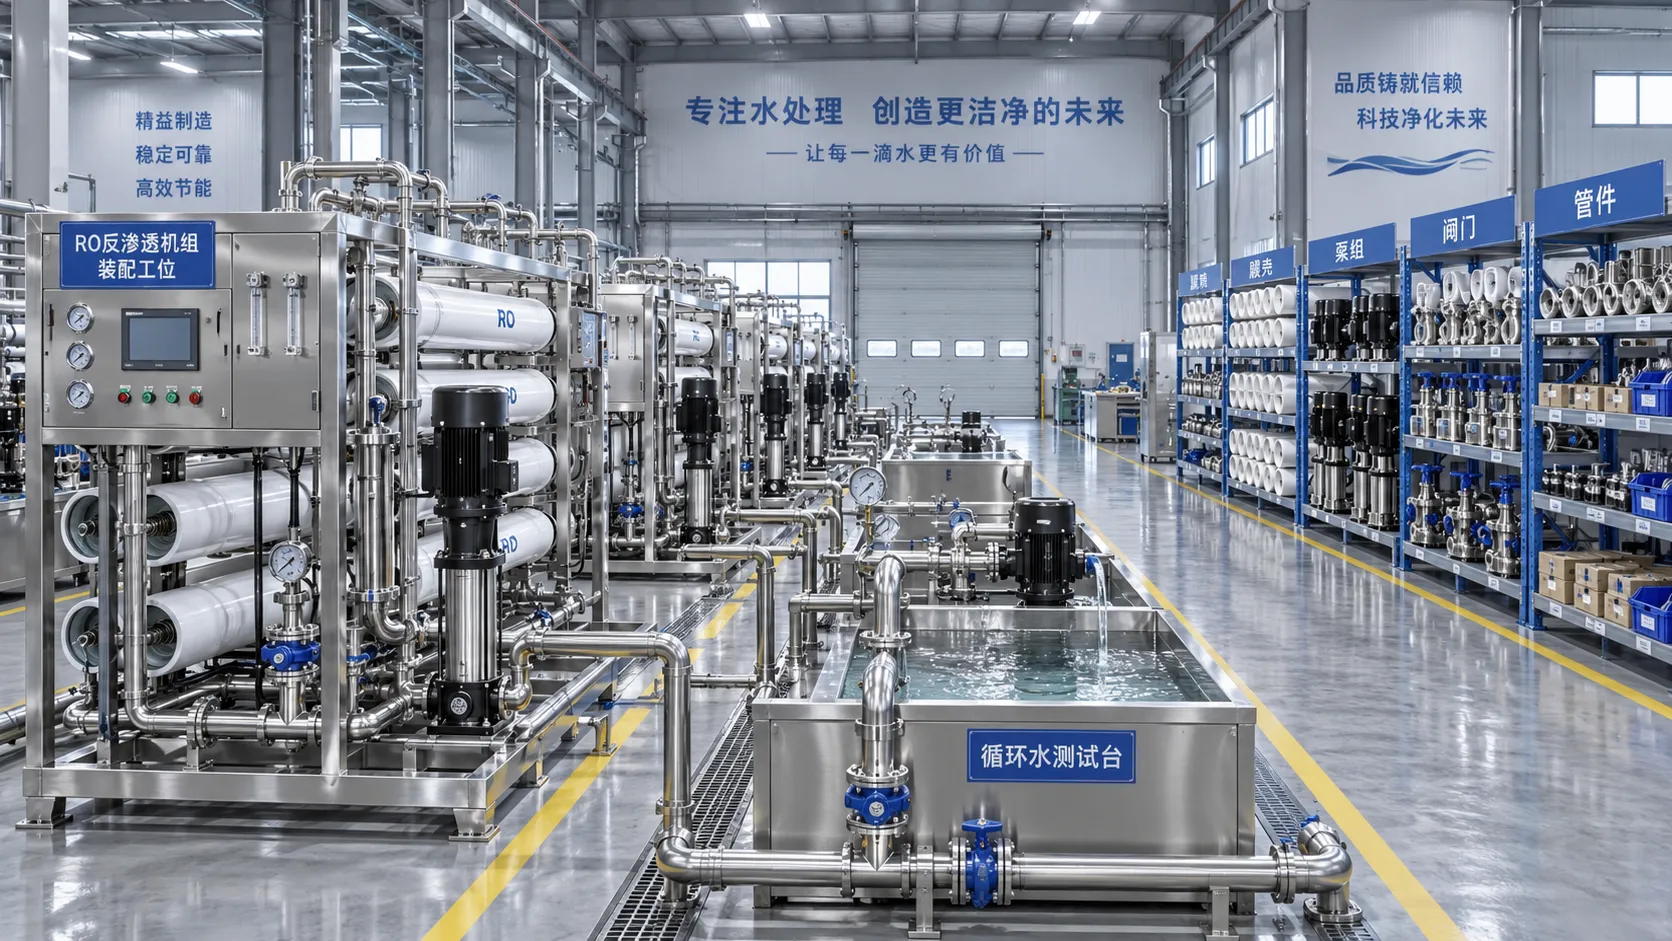
How to verify a water treatment system factory’s production capacity
Verify a water treatment systems factory’s production capacity through records, bottlenecks, component availability, and testing. Learn what to check before accepting a delivery promise.
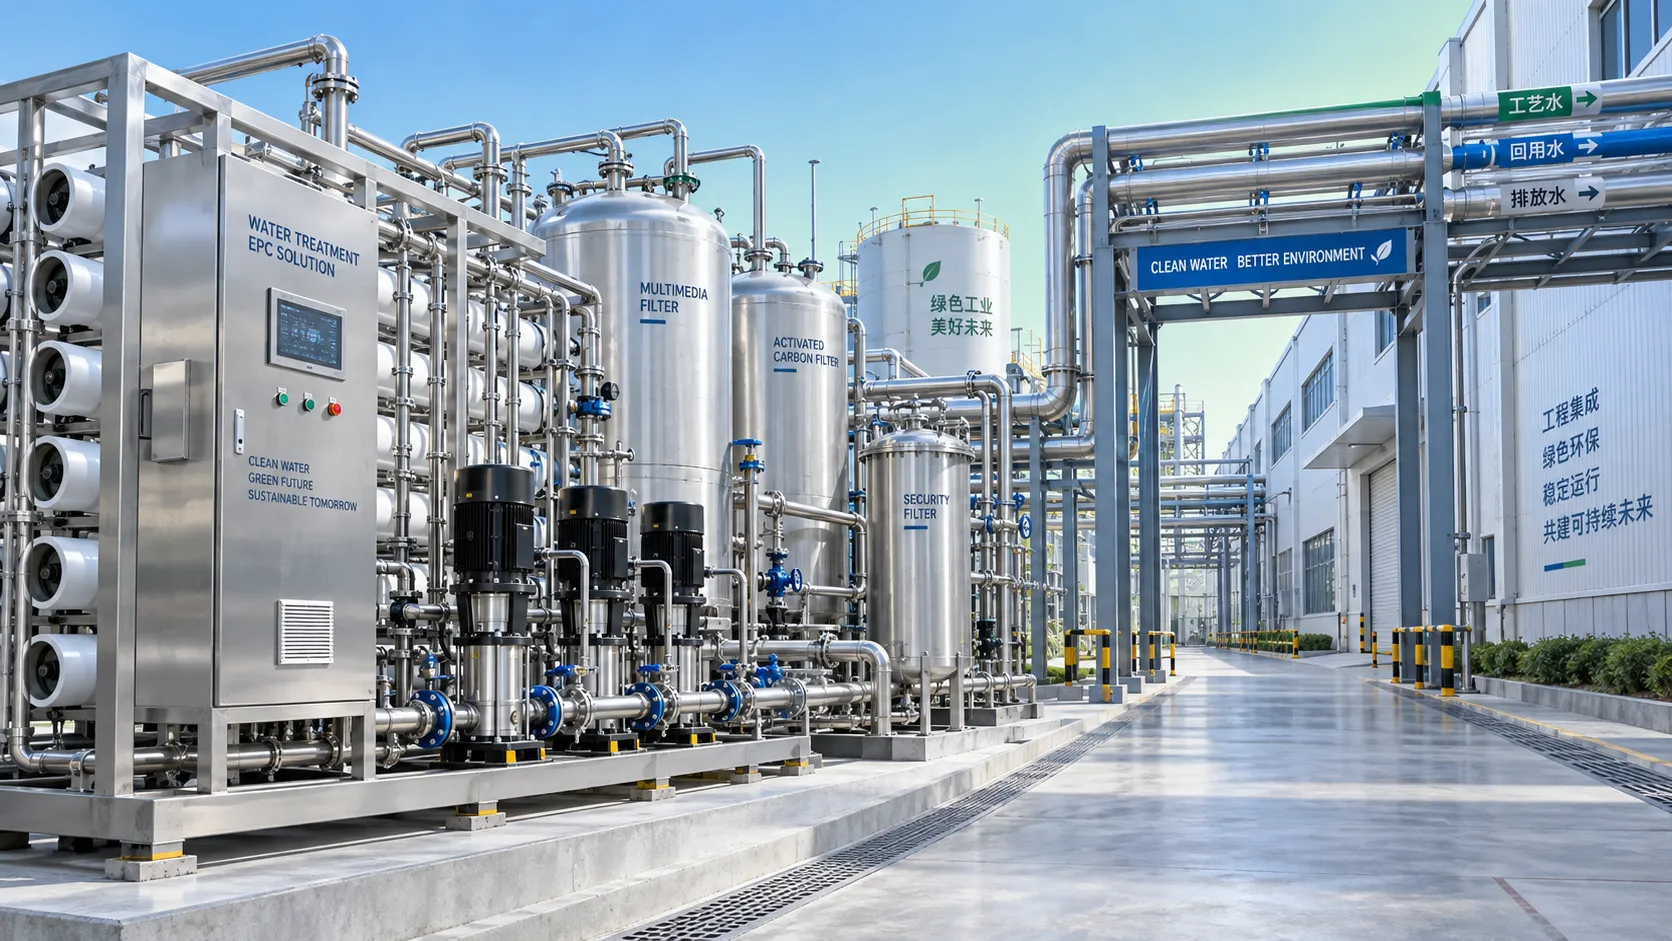
When does EPC environmental project support reduce delivery risk?
EPC environmental project support engineering reduces delivery risk by aligning design, procurement, compliance, construction, and commissioning decisions.
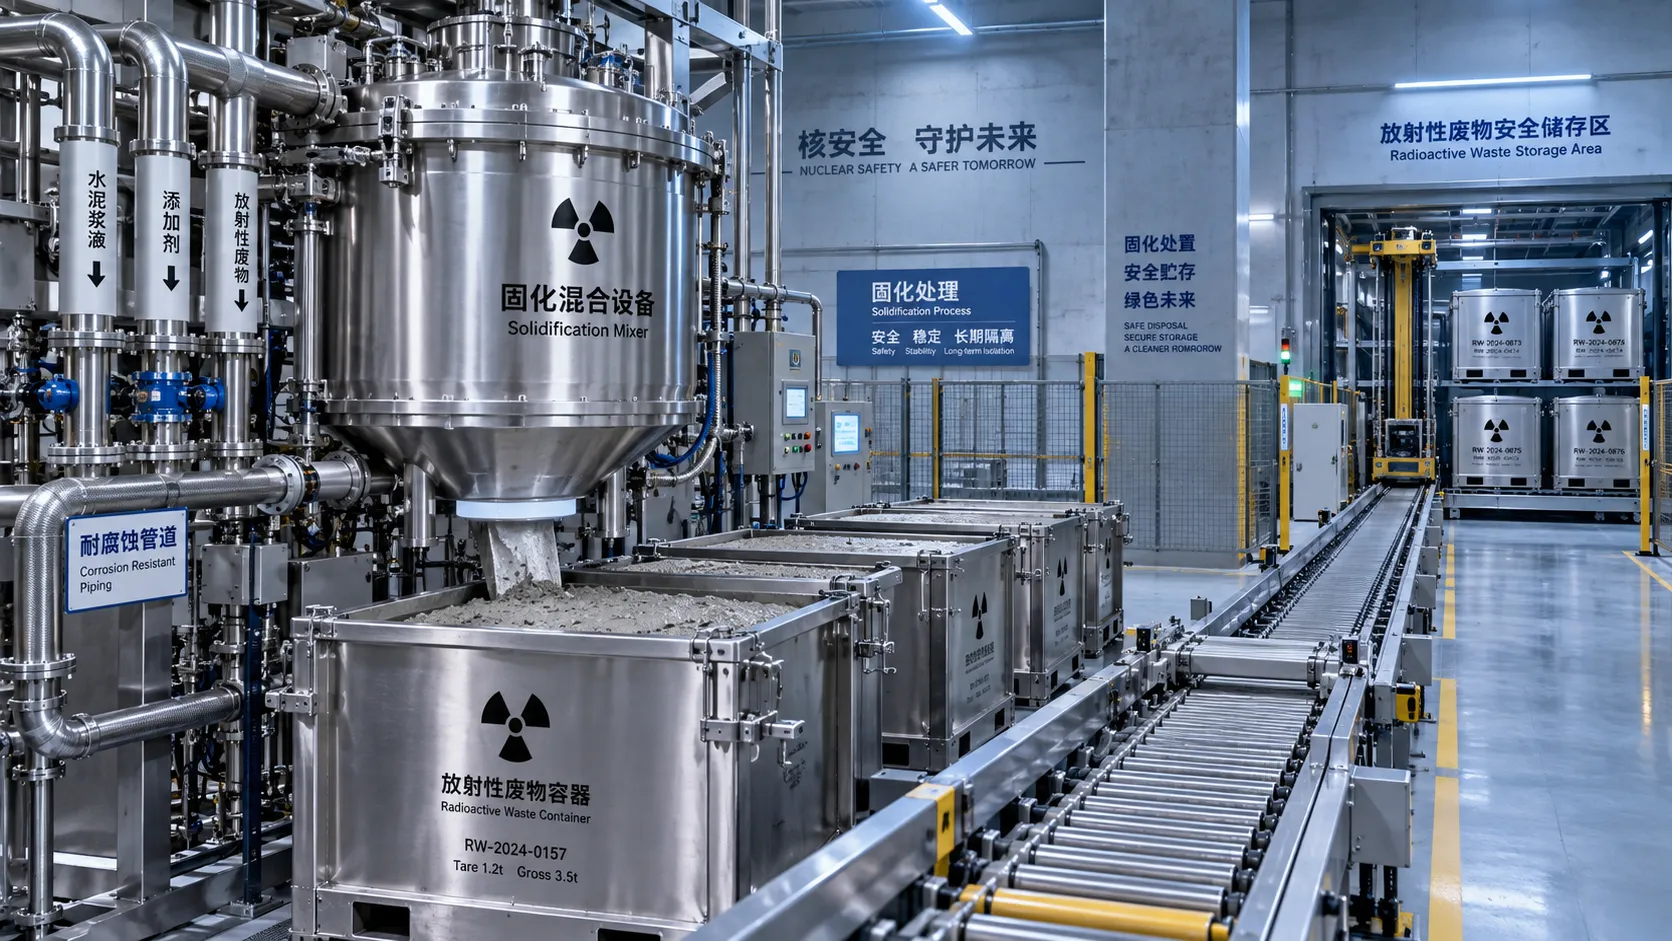
How nuclear plants select a radioactive waste solidification method
Radioactive waste management for nuclear plants: compare vitrification, cementation, polymers, and ceramics to select a compliant, durable solidification solution.
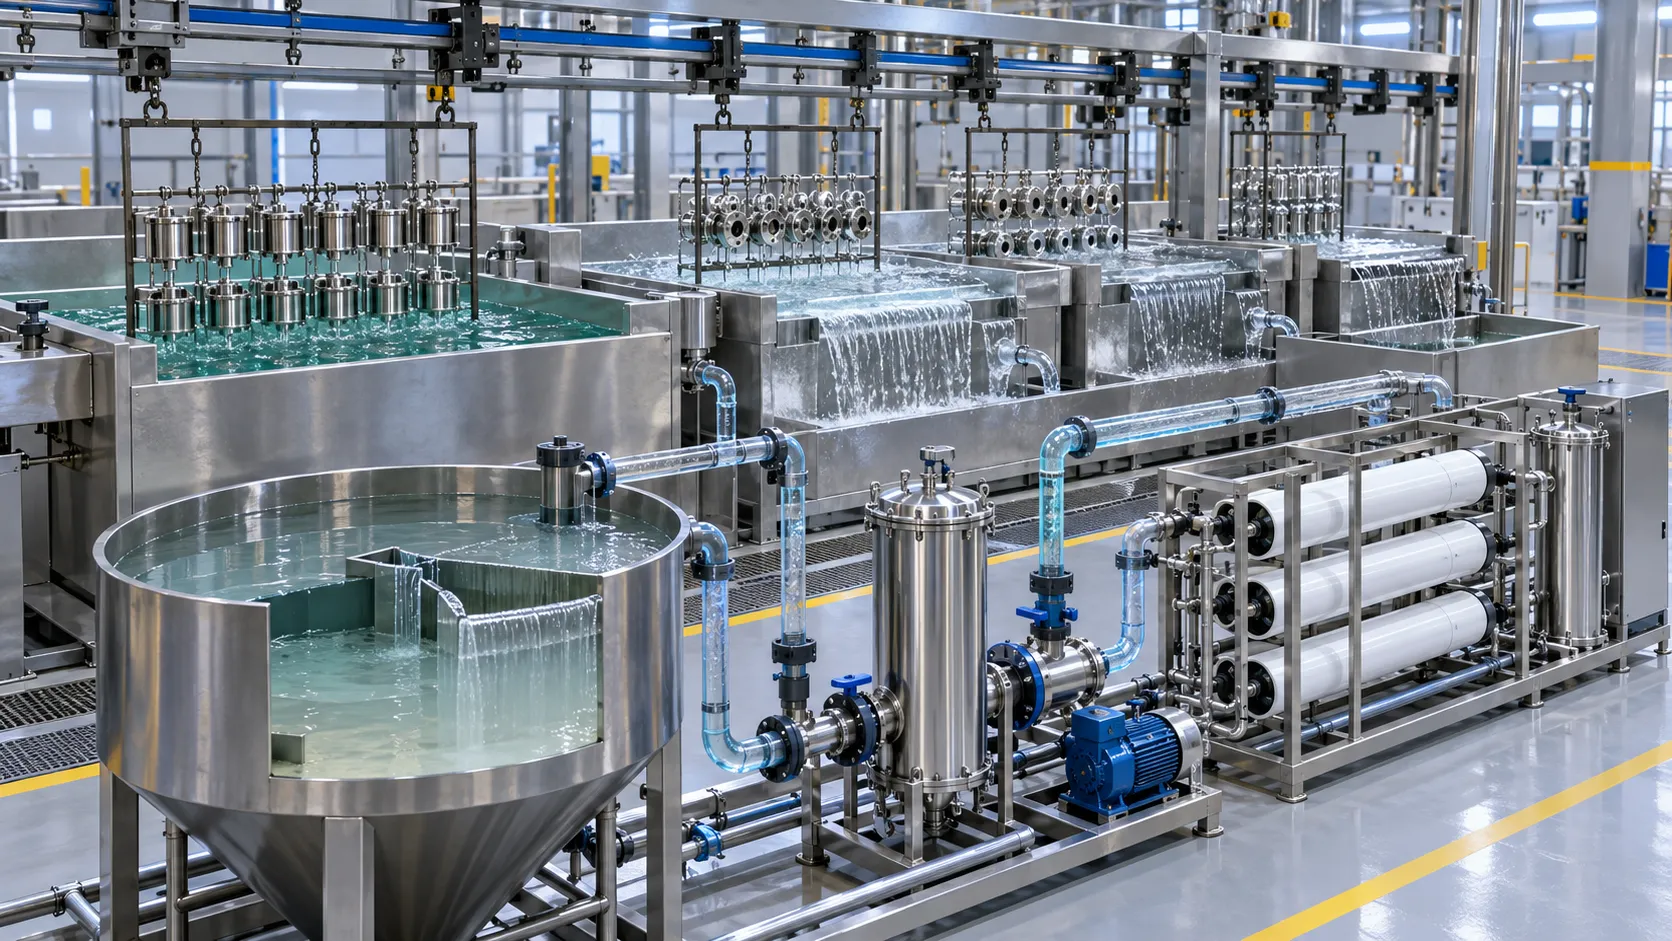
Water Treatment Options for Metal Finishing Rinse Water and Process Baths
Metal finishing water treatment solutions for rinse water and process baths—reduce costs, recover metals, improve reuse, and strengthen compliance.
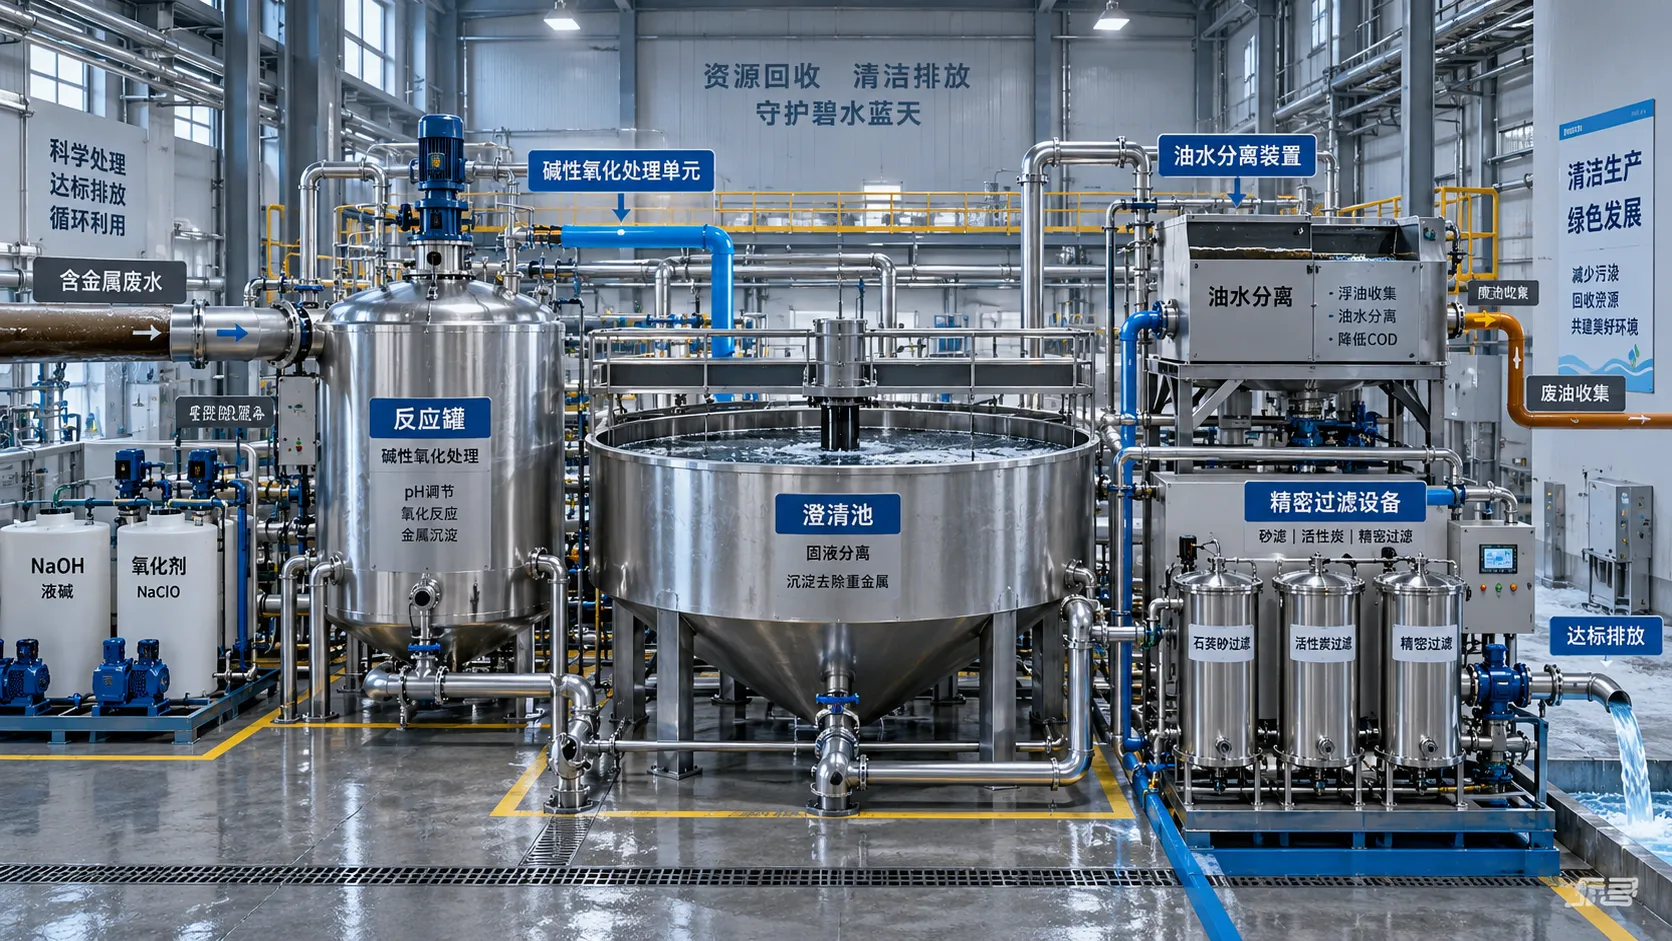
Treating Metal Finishing Wastewater: Removing Metals, Cyanide, and Oil Reliably
Metal finishing wastewater treatment made reliable: learn how to safely remove metals, cyanide, oil, and complex contaminants with proven stream segregation and control strategies.