
Industry News
Curation by industry experts
Hot Articles
Popular Tags
How to assess the sorting accuracy of AI waste sorting equipment
The most reliable way to assess AI waste sorting equipment is to measure what it separates from a representative waste stream at the intended operating rate. A supplier’s identification accuracy may describe how often a model labels visible objects correctly, but that figure alone does not show how much target material reaches the right output or how clean that output is.
A useful evaluation combines material recovery, output purity, throughput and availability with a clearly defined sampling method. It should also show how performance changes when the feed becomes more difficult: material overlaps, packaging is dirty, or the proportion of target items falls. These conditions determine whether an impressive demonstration translates into a commercially useful separation.
Start with the separation the equipment must deliver
Before comparing accuracy claims, define the target material and the intended destination of the sorted product. “Plastics recovery” is too broad for a meaningful acceptance test. Recovering PET bottles from a container stream is a different task from separating PET trays from mixed rigid plastics, particularly when labels, food residue or multilayer packaging complicate identification.
Specify which objects count as acceptable targets, which contaminants matter, and how composite or ambiguous items will be classified. A bale buyer may reject certain non-target polymers, while a downstream process may be more sensitive to metal, paper or moisture. The definition should reflect the output specification and the next processing step, not just the categories displayed on a machine interface.
Define the system boundary as well. A test may cover a single sorter, a sorter with a recirculation loop, or an entire line with manual quality control. Those are different claims. If one supplier includes a second pass and another reports only a single pass, their recovery figures should not be treated as directly comparable.
Separate identification accuracy from physical sorting performance
An AI model can recognize a target correctly and still fail to recover it. The item may be partially hidden, move unpredictably after detection, or be missed by an air jet. A correctly directed ejection can also carry nearby non-target material into the product stream.
Ask suppliers to distinguish sensor or model performance from the measured outcome at the discharge points. The following measures answer different questions:
For a mass-based assessment, calculate recovery as the mass of acceptable target material in the designated product divided by the mass of acceptable target material in the feed. Calculate purity as the mass of acceptable target material in that product divided by the total mass of the product. State both results on the same basis, including how attached residue and moisture are handled.
Object-count metrics can be useful for diagnosing missed bottles or incorrect classifications, but they should not be substituted for mass-based results when the commercial output is sold by weight. A stream containing many small, light items and a few heavy items can produce very different results depending on the measurement basis.
Read recovery and purity together
A sorter can often be adjusted to favor one outcome over the other. A more selective setting may produce a cleaner product but leave more acceptable material in the reject stream. A more aggressive setting may capture more of the target while increasing contamination.
Neither setting is inherently better. If the receiving facility has a strict input specification, high purity may be essential even at some recovery loss. If a downstream cleaning stage can remove certain contaminants economically, higher recovery may be preferable. Request paired recovery and purity results at the same settings and throughput, rather than the best figure for each metric from separate runs.
Design a test around the actual feed
A controlled demonstration is useful for checking whether a machine can recognize specific materials, but equipment selection requires a feed that resembles normal operation. Agree on the source, preparation and composition of the test material before the trial. If the operating line receives material after screening, shredding or manual pre-sorting, the test feed should reflect that stage.
Representative feed does not mean a single carefully blended sample. Waste composition can change between collection routes, shifts and seasons. Where feasible, test separately identifiable batches that capture meaningful variation, including lower target concentration, higher contamination and difficult material shapes. Report each batch rather than presenting only a combined average that conceals weak performance.
Pay attention to conditions that affect visibility and separation:
- Presentation: overlapping objects, belt coverage and uneven distribution can prevent the sensor from seeing all surfaces.
- Material condition: dirt, moisture, labels, dark surfaces and deformation can change the signals available to a sensor.
- Particle or object size: small pieces, flexible films and large containers may require different feeding and ejection arrangements.
- Contamination: attached residue or mixed-material packaging can make both classification and the definition of an acceptable product more difficult.
Do not allow the trial feed to be cleaned, singled out or manually arranged beyond what the proposed installation will routinely achieve. If preparation is necessary, record the equipment and labor required to provide it. A sorter that performs well only with carefully presented material may still be viable, but the upstream preparation belongs in the system cost and performance assessment.
Measure inputs, outputs and losses consistently
Agree on a sampling and weighing protocol before the run. Identify every relevant output, including the target product, rejects and any secondary product or recirculated stream. Collect samples over defined periods once the system is operating steadily, and account separately for start-up, shutdown and material remaining in the equipment where these affect the result.
Representative sampling matters as much as the formula. A handful taken from the top of a discharge pile may not reflect material distributed across the full stream. Use a documented method for collecting increments over time and across the stream, then sort the samples into the agreed categories. Record sample masses, collection times, sorting rules and any material that cannot be classified confidently.
Where direct feed sampling is difficult, the target material entering the assessed boundary can be estimated from the classified outputs, provided all relevant outputs are captured and losses or retained material are addressed. Compare total input and output mass as a reasonableness check. A large unexplained difference weakens confidence in both recovery and purity.
For a recirculation system, avoid counting the same material as new feed each time it passes through the sorter. Measure the final product and final losses against material entering the defined system boundary. Otherwise, repeated passes can make the reported recovery difficult to interpret.
Test at the throughput the operation needs
Sorting performance should be tied to a measured feed rate, not merely a belt speed or a machine’s stated capacity. Two trials at the same mass rate can present very different challenges if one stream contains mostly compact bottles and the other contains bulky film or irregular objects.
Run the equipment at the intended operating rate and, where useful, at lower and higher rates to show the performance curve. Note belt coverage, feed distribution and the proportion of the belt that is obscured by overlapping items. If recovery deteriorates at the required rate, the practical choice may be a wider line, additional sorting capacity, improved feed preparation or a lower operating rate.
The test should also continue long enough to expose ordinary operating effects such as sensor window fouling, material buildup and interruptions. Record productive operating time separately from stoppages and cleaning. A short run can demonstrate sorting capability, but it cannot by itself establish sustained availability or maintenance demand.
Investigate the causes of missed material and contamination
When a result falls short, inspect the outputs before concluding that the AI model is inadequate. Missed target material can originate at several points: it was hidden from the sensor, outside the detectable size range, classified incorrectly, detected too late, or not moved into the intended discharge. Contamination may result from false identification, neighboring objects being ejected together, or poorly controlled discharge trajectories.
These failure modes point to different remedies. Better singulation may improve visibility; sensor cleaning may restore signal quality; changes to belt speed, timing or air pressure may improve physical separation. Some materials may require a different sensing approach or an upstream process change. Ask whether the supplier can distinguish detection errors from ejection errors in its test records.
Also examine the limits of the sensing arrangement. Camera-based systems rely on visible features, while other sensor types may provide information about material composition. Performance depends on the material and its presentation; a combination of sensors is not automatically superior if the limiting issue is buried material or poor mechanical separation. The test should demonstrate the complete proposed configuration.
Turn trial results into a procurement decision
Compare suppliers using the same target definition, feed batches, system boundary and operating rate. Alongside recovery and purity, request the settings used, raw sample classifications, downtime, energy and compressed-air requirements where relevant, and the amount of upstream preparation needed. A single headline percentage is not a substitute for this record.
Evaluate the commercial consequences of the measured outputs. Higher recovery has value only if the additional material can be processed or sold; higher purity has value when it reduces rejection, manual re-sorting or downstream treatment. Include consumables, maintenance, staffing and lost production time when comparing configurations. A lower-purity output may be acceptable for an internal cleaning process but unsuitable for direct sale.
Finally, translate the evaluation into acceptance criteria for the installed system. Define the target categories, measurement basis, test feed, throughput, sampling protocol and required recovery and purity together. State how interruptions, recirculation, ambiguous material and repeated tests will be handled. This makes the purchase decision traceable to an operating outcome rather than to an isolated laboratory or demonstration claim.
Recommended News
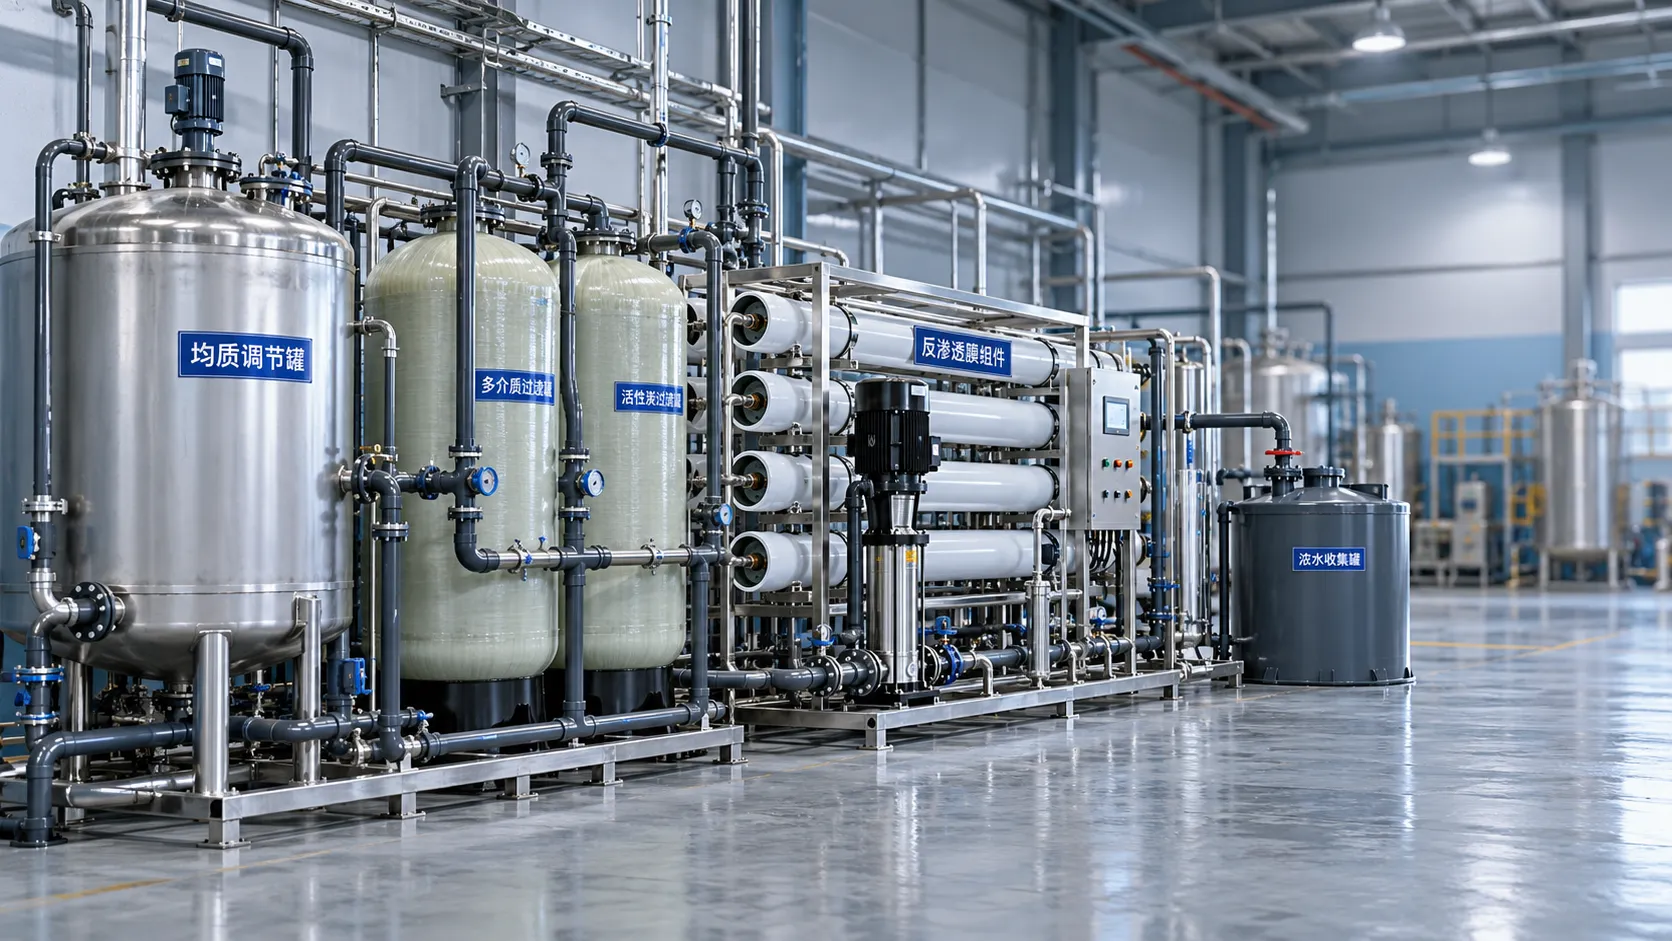
Choosing purification systems for chemical plants by contaminant load
Use this industrial purification systems guide for chemical plants to match treatment to contaminant loads, reduce operating risks, and improve water reuse. Explore smarter system choices.
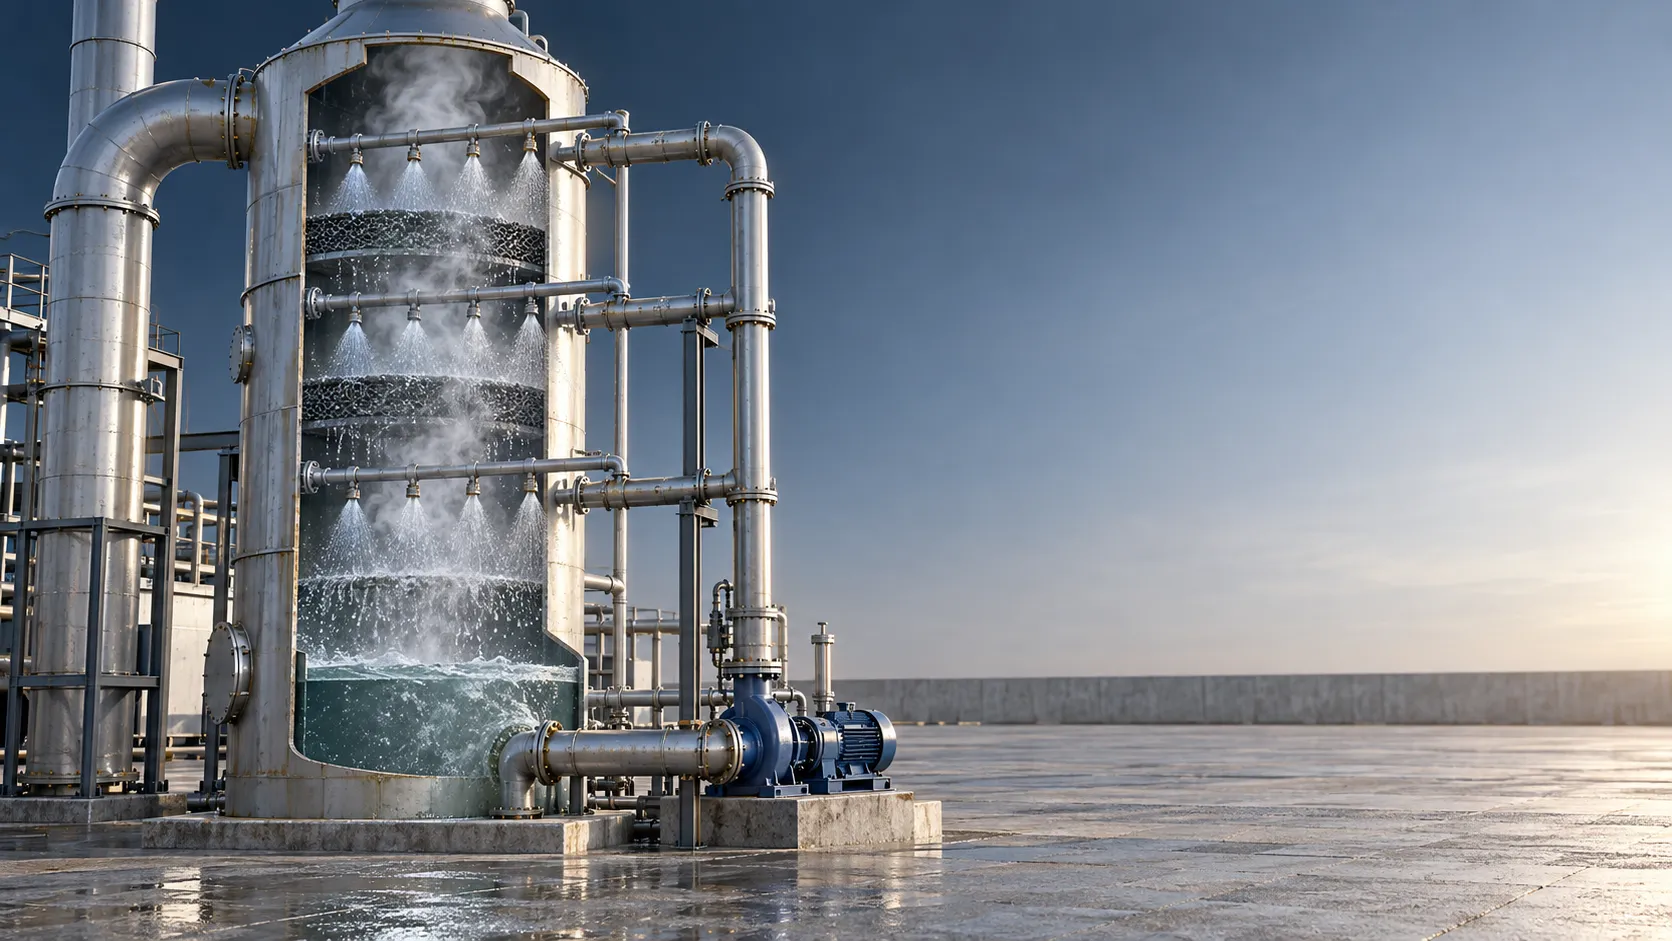
How liquid-to-gas ratio affects wet flue gas scrubbing design
Optimize flue gas scrubbing design with the right liquid-to-gas ratio. Discover how chemistry, hydraulics, and pumping costs shape reliable, cost-effective emissions control.
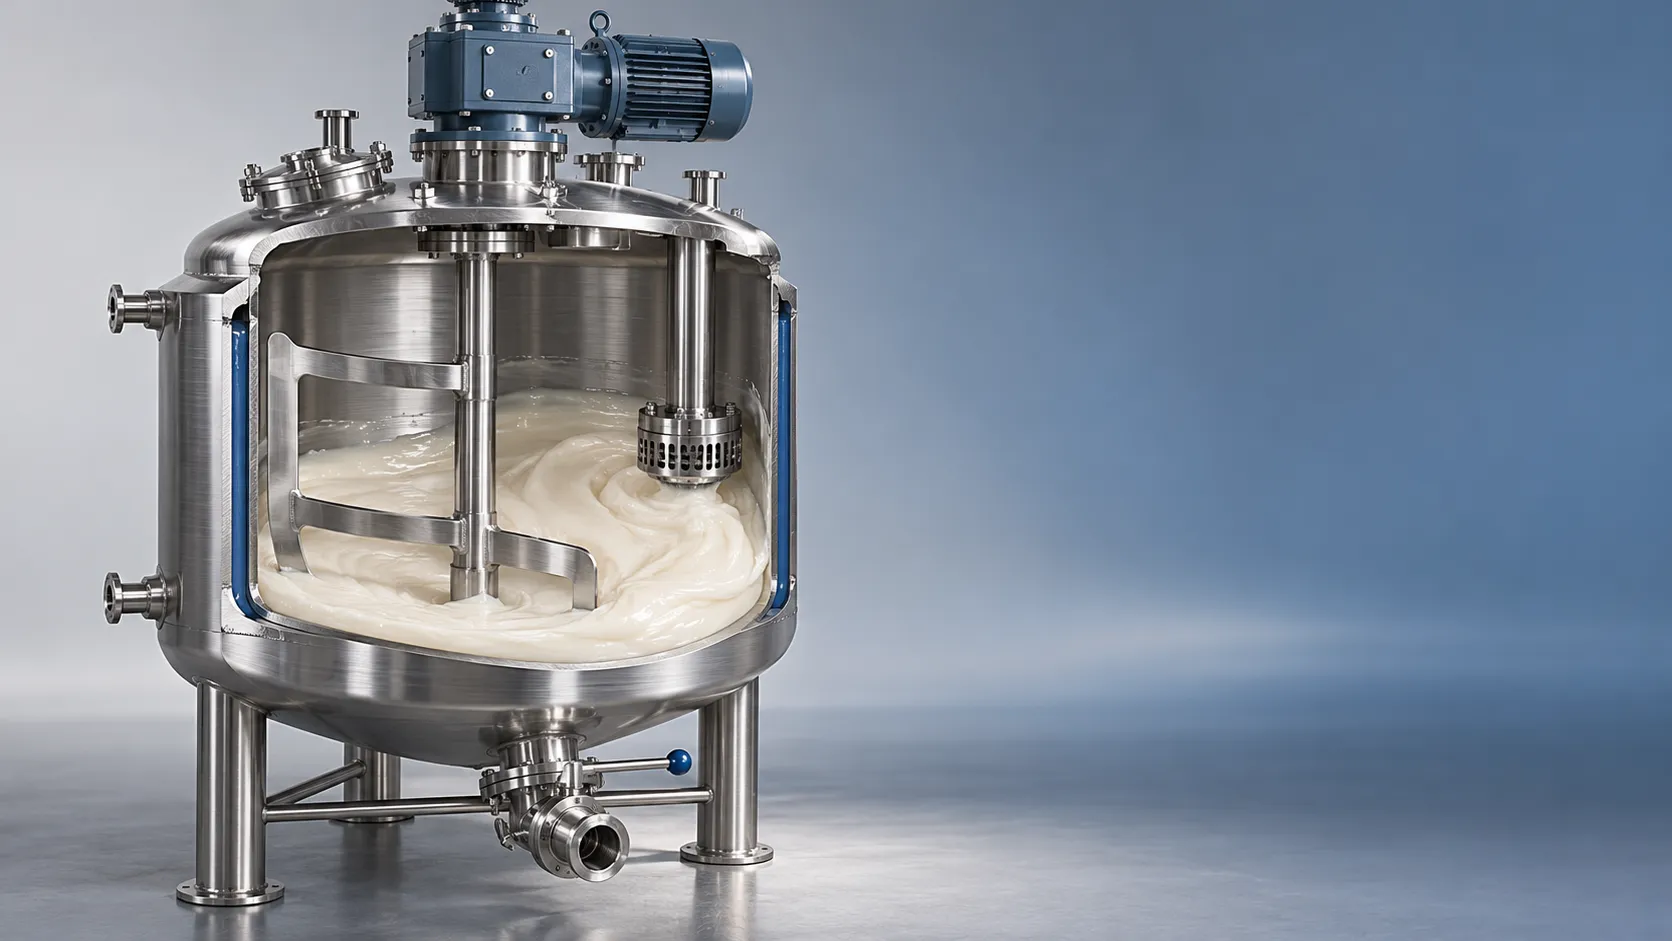
How to size ingredient mixing equipment for viscous formulations
Size mixing ingredient processing equipment for viscous formulations with expert guidance on rheology, torque, and heat removal. Learn how to select a system that delivers reliable batch performance.
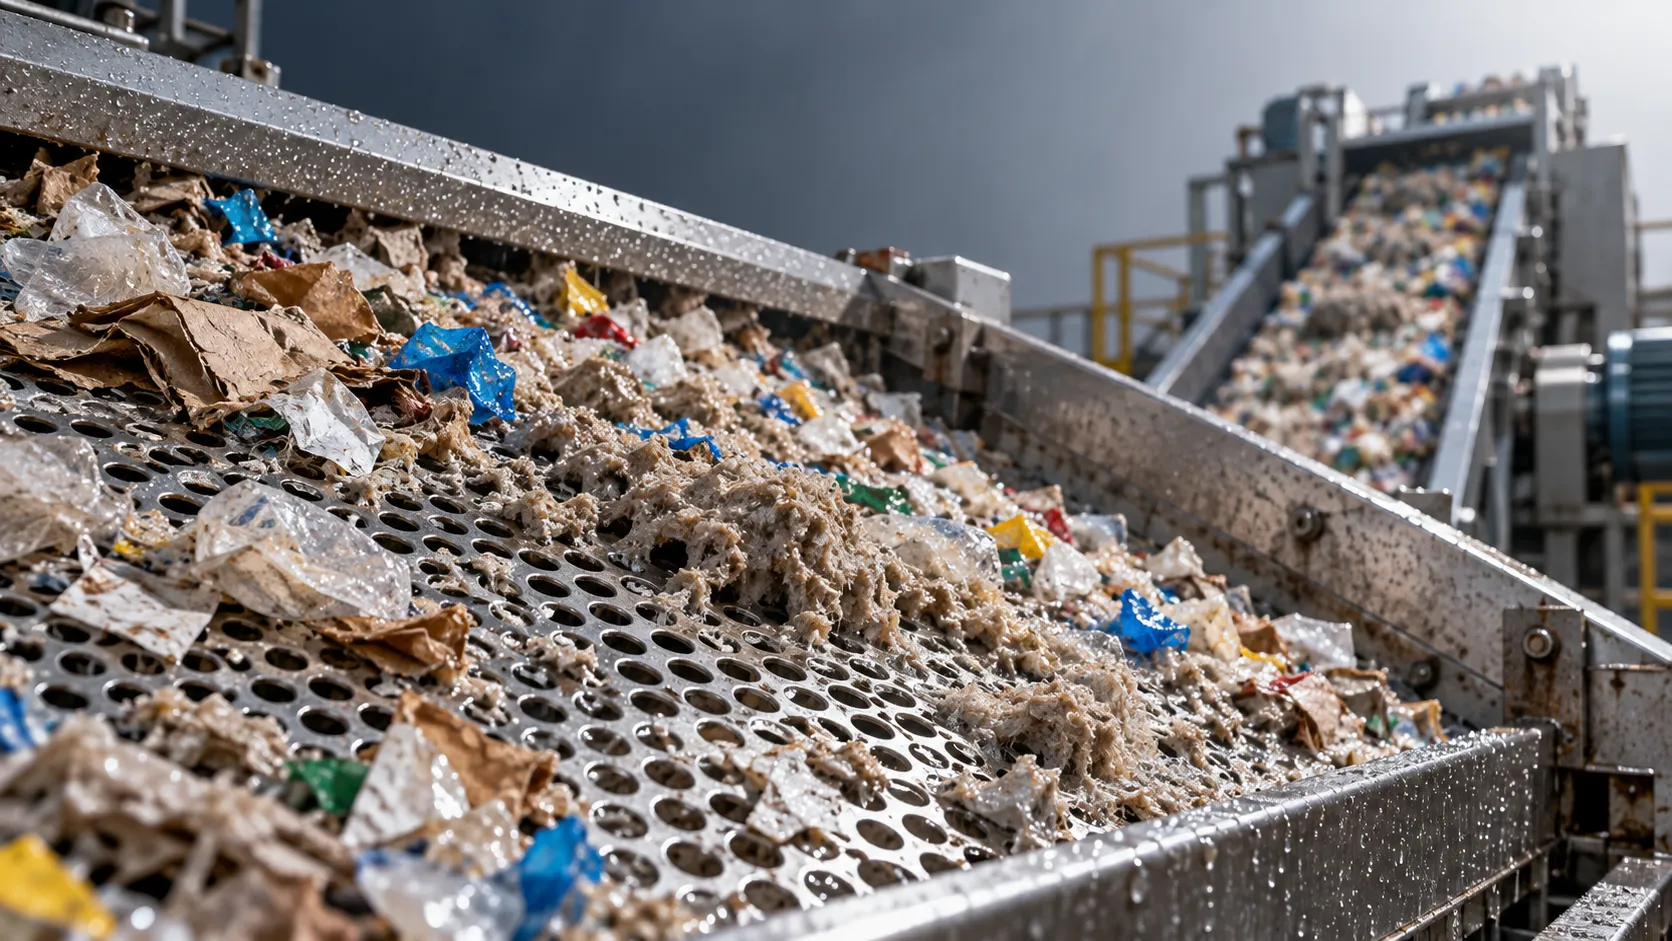
How moisture affects material separation in solid waste recovery
Improve solid waste recovery material separation by understanding moisture effects on screening and sorting. Discover practical ways to boost recovery, purity, and throughput.
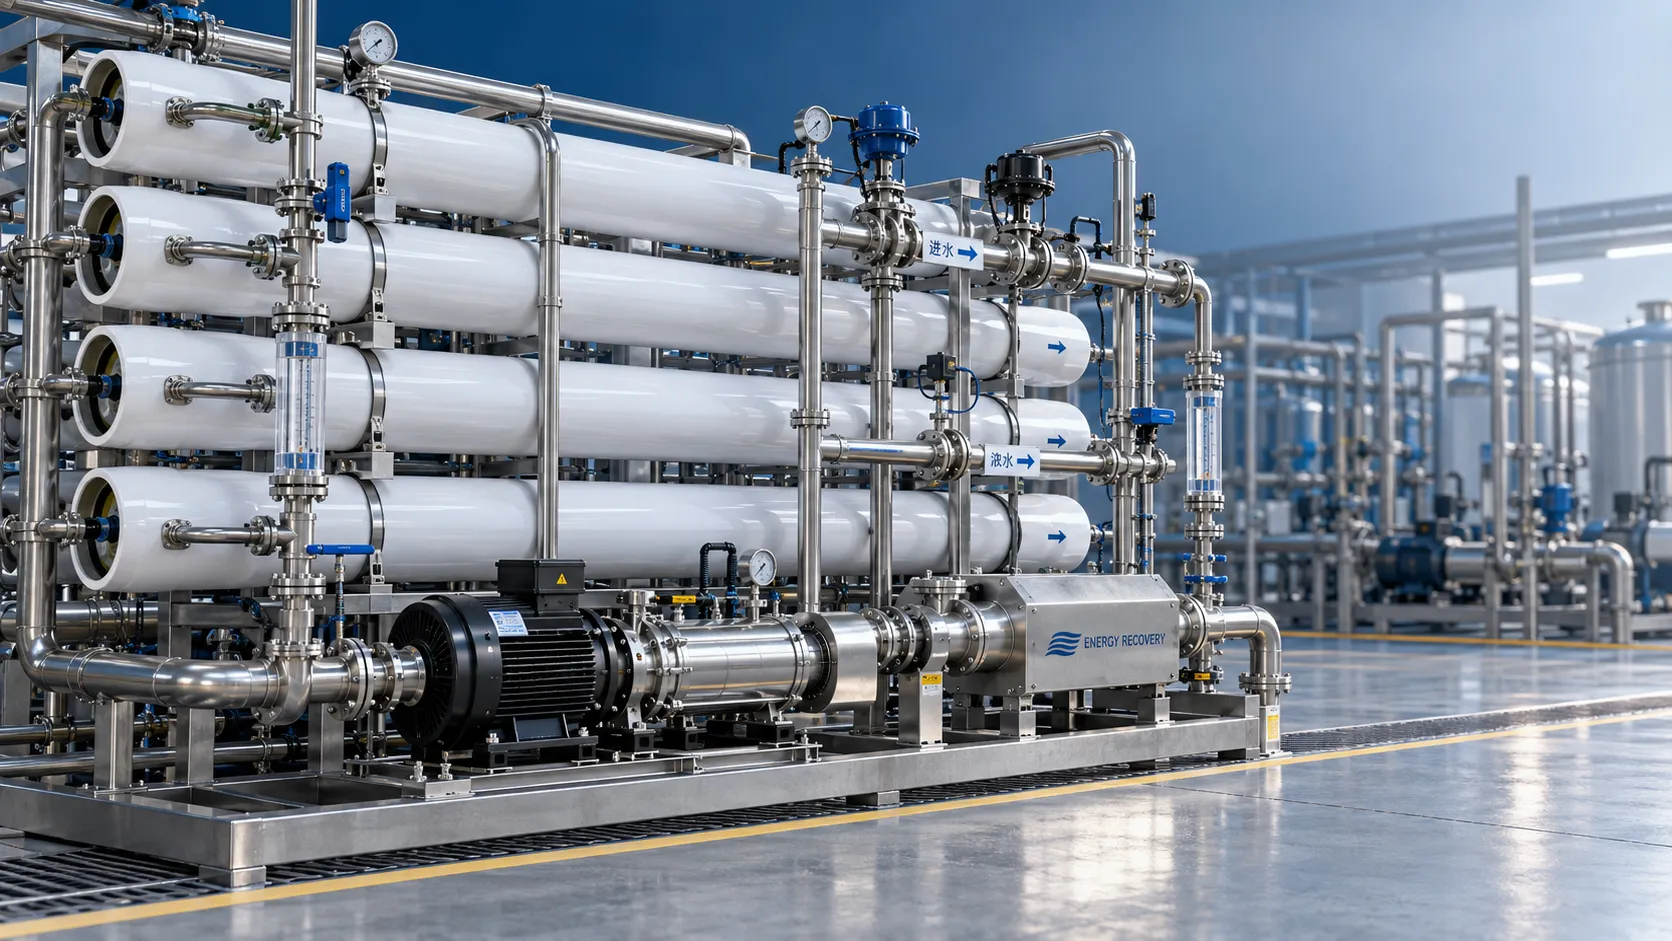
How to set recovery rates in seawater reverse osmosis system design
Explore seawater desalination systems engineering: learn to set SWRO recovery rates that balance energy, scaling risks, and water quality for reliable, cost-effective operation.
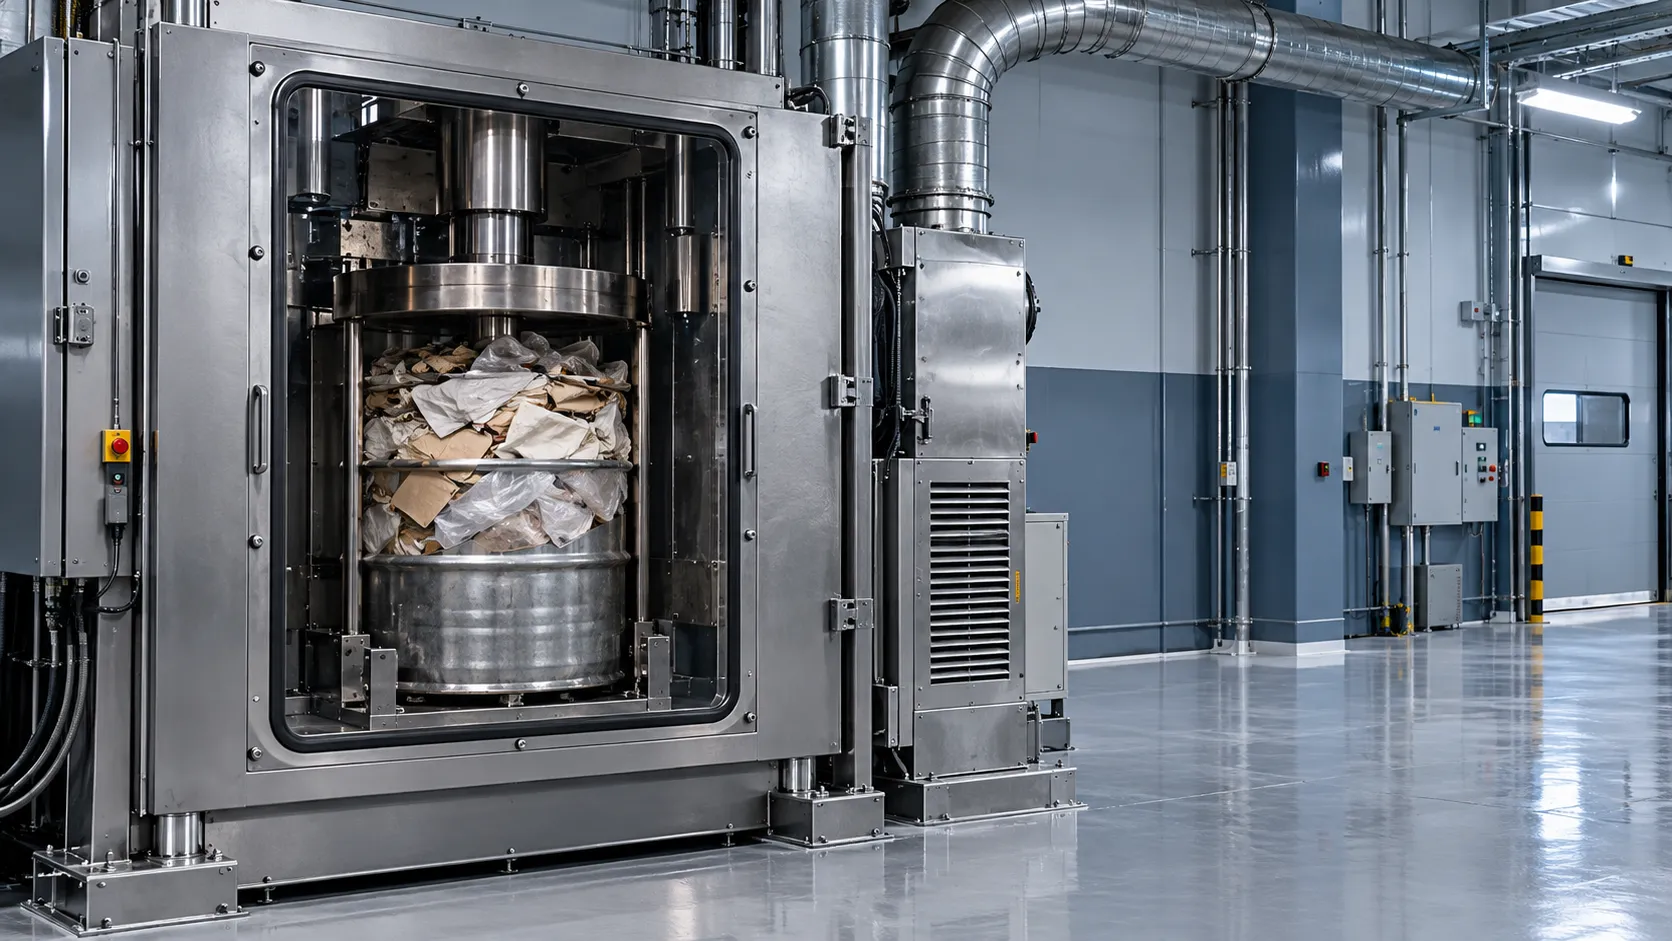
When is compaction suitable for solid nuclear waste treatment?
Is compaction right for solid nuclear waste treatment? Discover suitable waste streams, key safety checks, and disposal requirements to reduce package volume and optimize costs.
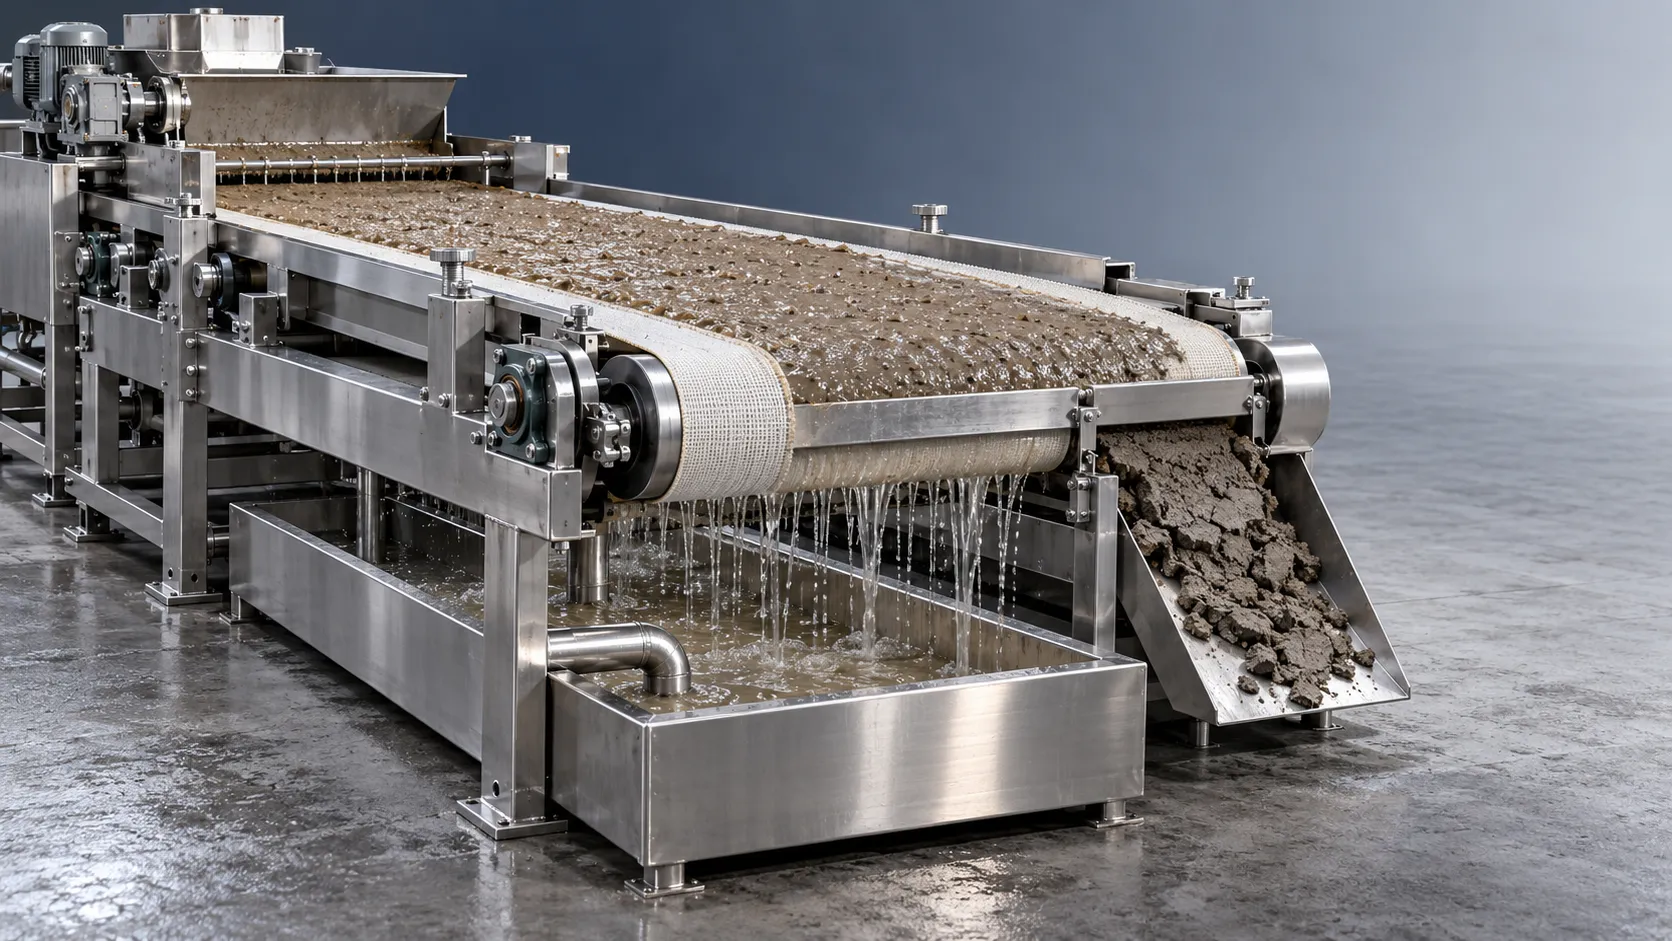
How solids concentration affects dewatering in waste recovery systems
Optimize waste recovery systems dewatering with insights on solids concentration. Learn to balance throughput, cake dryness, and solids capture while avoiding costly equipment overloads.
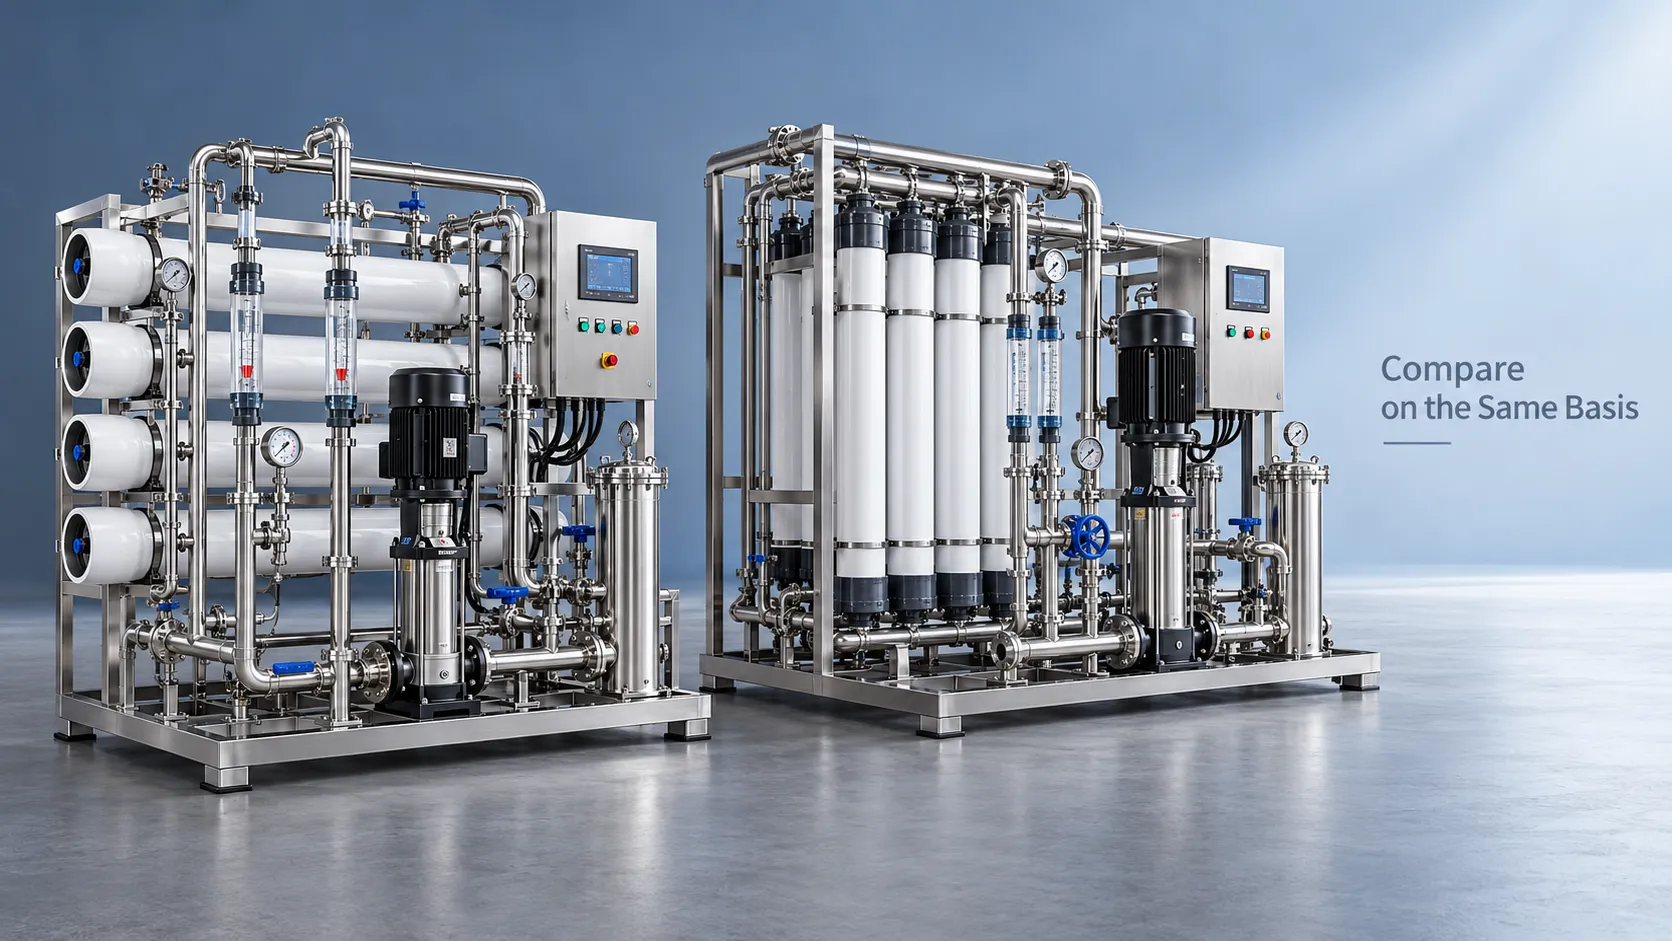
How to compare technical specs in an environmental equipment directory
Use this environmental equipment directory technical guide to compare capacity, energy use, compliance, and supplier evidence. Build a defensible shortlist and choose with confidence.
How to assess a zero liquid discharge equipment supplier’s energy claims
Assess a zero liquid discharge equipment supplier’s energy claims. Learn how to verify system boundaries, compare real costs, and demand testable guarantees before you buy.