
Industry News
Curation by industry experts
Hot Articles
Popular Tags
Membrane Filtration Technology: When Performance Drops and What to Check
Membrane Filtration Technology: When Performance Drops and What to Check
In membrane filtration technology, a sudden drop in flux rarely happens without a reason. Rising differential pressure, unstable permeate quality, and frequent cleaning alarms usually point to a deeper operating issue.
The first job is not to guess. It is to separate normal aging from a correctable fault. That distinction saves time, protects compliance, and avoids unnecessary membrane replacement.
In real projects, membrane filtration technology is often judged by three visible results: stable flux, acceptable pressure loss, and consistent treated water quality. When one moves, the others usually follow.
This guide breaks down what to check first, how to narrow the root cause, and which operating conditions most often damage membrane filtration technology performance.
Start with the Three Core Symptoms
Most membrane filtration technology failures appear through one of three symptoms. Flux drops. Differential pressure climbs. Permeate conductivity, turbidity, or TOC becomes unstable.
A flux decline usually suggests fouling, scaling, lower feed temperature, or pump underperformance. A pressure increase often signals blockage, channel restriction, or solids loading.
If permeate quality changes first, membrane damage, seal leakage, chemical attack, or bypass problems become more likely. That is often the sharper warning sign.
The key is to compare which symptom appeared first. In membrane filtration technology, the sequence often reveals the failure mechanism faster than one isolated reading.
Quick first-pass checks
- Compare current flux against normalized historical values.
- Check differential pressure by stage, not only system total.
- Review feed pressure, concentrate pressure, and permeate backpressure.
- Confirm feed temperature and recovery rate changes.
- Verify online analyzer calibration before trusting the trend.
Check Whether the Data Is Telling the Truth
Before opening housings or planning a CIP, confirm the instruments are reliable. In membrane filtration technology, bad data creates bad maintenance decisions very quickly.
Pressure transmitters drift. Flowmeters foul. Conductivity probes age. Even a clogged impulse line can mimic a severe membrane issue that does not actually exist.
Look at raw trends and manual readings together. If the SCADA trend says pressure rose sharply but field gauges do not agree, troubleshoot instrumentation first.
This matters especially in large water treatment plants and desalination systems, where membrane filtration technology operates close to optimization limits and small reading errors can trigger unnecessary shutdowns.
Instrument points worth verifying
- Feed, interstage, and reject pressure transmitters.
- Permeate, feed, and concentrate flowmeters.
- Conductivity, pH, ORP, and turbidity analyzers.
- Temperature compensation on normalized performance reports.
- Valve position feedback for recirculation and bypass lines.
Look Upstream Before Blaming the Membrane
A large share of membrane filtration technology problems begin before the membrane skid. Pretreatment instability is one of the most common root causes behind repeated performance decline.
If multimedia filtration is leaking fines, cartridge filters are bypassing, or coagulant dosing shifts, the membrane receives a feed it was never designed to handle.
Chlorine breakthrough is another classic example. In many membrane filtration technology systems, oxidant exposure quietly damages the active layer before flux changes become obvious.
From a troubleshooting standpoint, always compare the event timeline. A backwash failure, antiscalant drum change, or chemical dosing interruption often explains the later membrane symptoms.
Upstream items to review
- SDI or turbidity trend before the membrane train.
- Cartridge filter differential pressure and replacement quality.
- Dechlorination residual and dosing pump stability.
- Antiscalant concentration, dilution quality, and injection point.
- pH correction and coagulant overdosing risk.
Identify the Main Failure Mode
Once the data is trusted and pretreatment is checked, classify the likely mechanism. In membrane filtration technology, most performance loss fits into fouling, scaling, biological growth, or physical damage.
Organic and colloidal fouling
This usually appears as gradual flux decline with moderate pressure rise. It is common when surface water quality swings, solids carryover increases, or chemical conditioning is unstable.
Inorganic scaling
Scaling often hits the tail elements first. Differential pressure may rise unevenly. Recovery changes, antiscalant mismatch, and concentrate chemistry shifts are frequent triggers.
Biofouling
Biofouling in membrane filtration technology can move fast after warm weather, nutrient excursions, or poor sanitization. Pressure drop rises early, and cleaning becomes less effective over time.
Chemical or mechanical damage
If permeate quality drops suddenly without strong pressure change, suspect oxidation, seal failure, telescoping, broken spacers, or improper shutdown and restart handling.
What to Inspect on the Skid
Field inspection should be systematic. In membrane filtration technology, random checks waste precious response time, especially when production pressure is already high.
- Listen for pump cavitation, unstable vibration, or seal leakage.
- Check whether control valves are hunting or partially stuck.
- Inspect for permeate backpressure caused by blocked downstream piping.
- Review vessel-by-vessel differential pressure if available.
- Confirm no incorrect valve lineup after maintenance or CIP.
- Check O-rings, brine seals, adapters, and element loading direction.
A useful habit is to compare one train against another operating under similar feed conditions. In membrane filtration technology, healthy parallel trains provide a fast benchmark.
If one train declines much faster, the cause is often local. Think valve position, damaged element, blocked cartridge housing, or uneven chemical distribution.
Use Cleaning Results as Diagnostic Evidence
A CIP is not only a recovery step. It is also a diagnostic tool. How membrane filtration technology responds to cleaning says a lot about the true cause.
If alkaline cleaning restores flux well, organic fouling was likely dominant. If acid cleaning improves differential pressure, scale may have been the main issue.
If recovery after CIP is weak, do not simply repeat the same procedure. That often means the chemistry, soak time, temperature, or flow regime was wrong.
In tougher cases, low recovery after cleaning points toward irreversible fouling or membrane damage. At that stage, autopsy or element swap testing may be justified.
Questions after each CIP
- Was the pH within the chemical supplier range?
- Did cleaning temperature meet the recommended window?
- Was recirculation flow high enough for turbulence?
- Did the spent solution indicate solids, organics, or biological loading?
- How much normalized flux was recovered after stabilization?
Common Root Causes That Get Missed
Some membrane filtration technology problems hide in ordinary operations. They are easy to overlook because the system still runs, just less efficiently than before.
- Feed temperature dropped, but normalized analysis was not used.
- Recovery slowly increased after control tuning changes.
- Chemical drums were replaced with incompatible product grades.
- Intermittent shutdowns encouraged biological growth and compaction.
- Cartridge filters were changed, but seals were not seated correctly.
- A recent membrane replacement mixed element types in one train.
These are small operational details, yet they repeatedly reduce membrane filtration technology reliability across desalination, industrial reuse, and high-purity water applications.
Build a Practical Troubleshooting Sequence
A repeatable sequence helps teams respond faster and document lessons better. It also reduces unnecessary element replacement and supports better lifecycle cost control.
- Confirm the symptom using normalized and manual data.
- Verify sensors, analyzers, and valve positions.
- Review pretreatment and chemical dosing events.
- Classify likely fouling, scaling, biological, or damage mode.
- Inspect skid equipment and compare parallel trains.
- Select targeted CIP or deeper forensic checks.
- Record recovery data and update prevention actions.
For organizations tracking broader environmental equipment performance, this same discipline supports stronger reliability across water reuse, seawater desalination, and other critical eco-shield assets.
Membrane filtration technology performs best when troubleshooting stays evidence-based. Check the data first, follow the process upstream, and let the symptom pattern guide the decision.
When performance drops, early structured checks usually reveal the answer. Act quickly, document clearly, and use each event to make the next intervention faster and more precise.
Recommended News
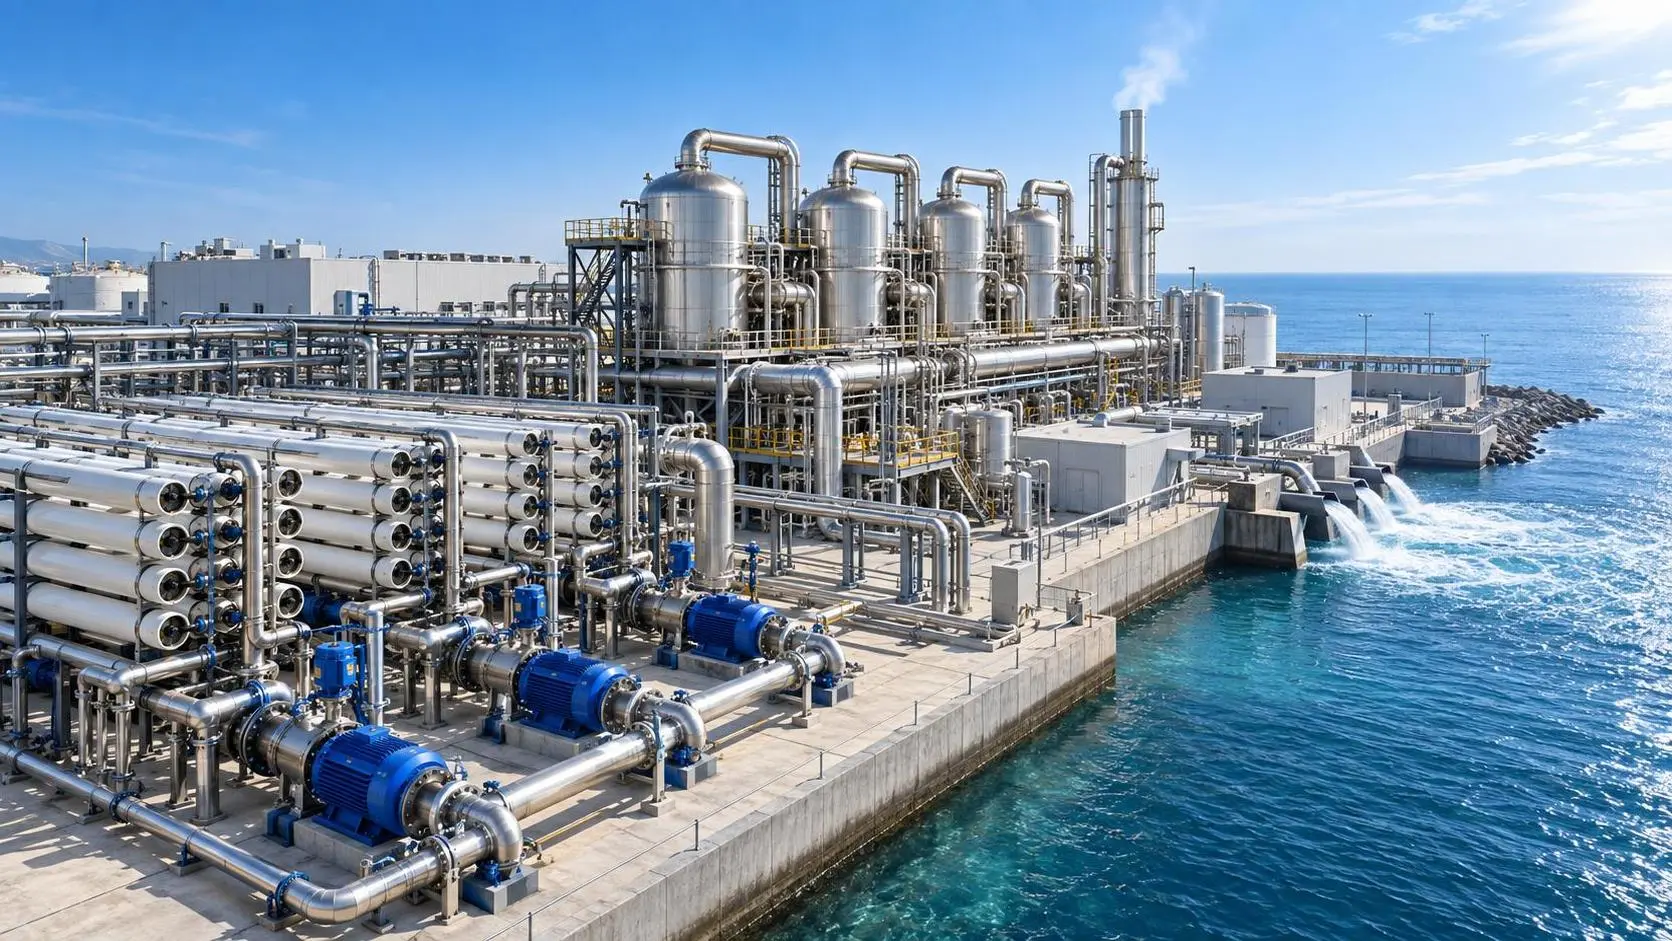
RO vs MED desalination: which is more energy-efficient at scale?
Desalination technology comparison: RO vs MED at scale. See how energy use, waste heat, feedwater, carbon, and flexibility determine the best choice.
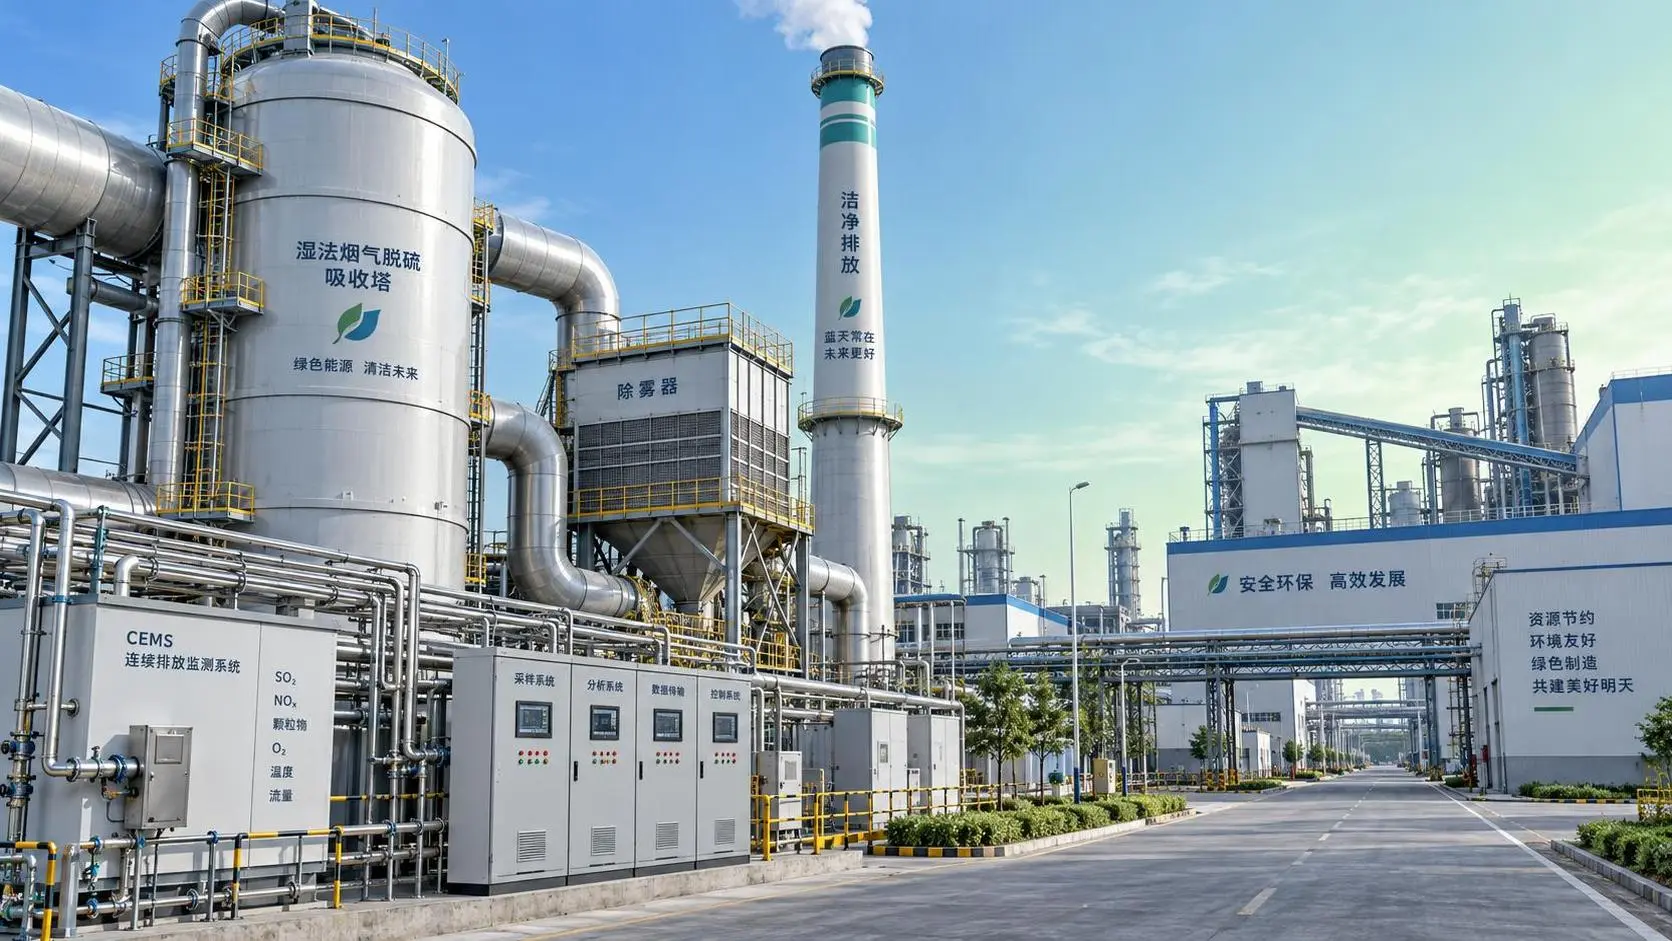
Which ISO standards apply to flue gas treatment systems?
Flue gas treatment systems ISO standards: explore key requirements for emissions testing, CEMS, safety, fabrication, corrosion control, and compliant project evaluation.

When corrosion resistant purification systems are needed for brine treatment
Corrosion resistant purification systems for brine treatment: assess chloride, heat, scaling, materials, and lifecycle reliability for demanding water projects.

How preventive maintenance reduces seawater desalination equipment downtime
Seawater desalination equipment maintenance reduces downtime through proactive monitoring, pretreatment protection, and planned repairs. Explore practical strategies for reliable RO performance.
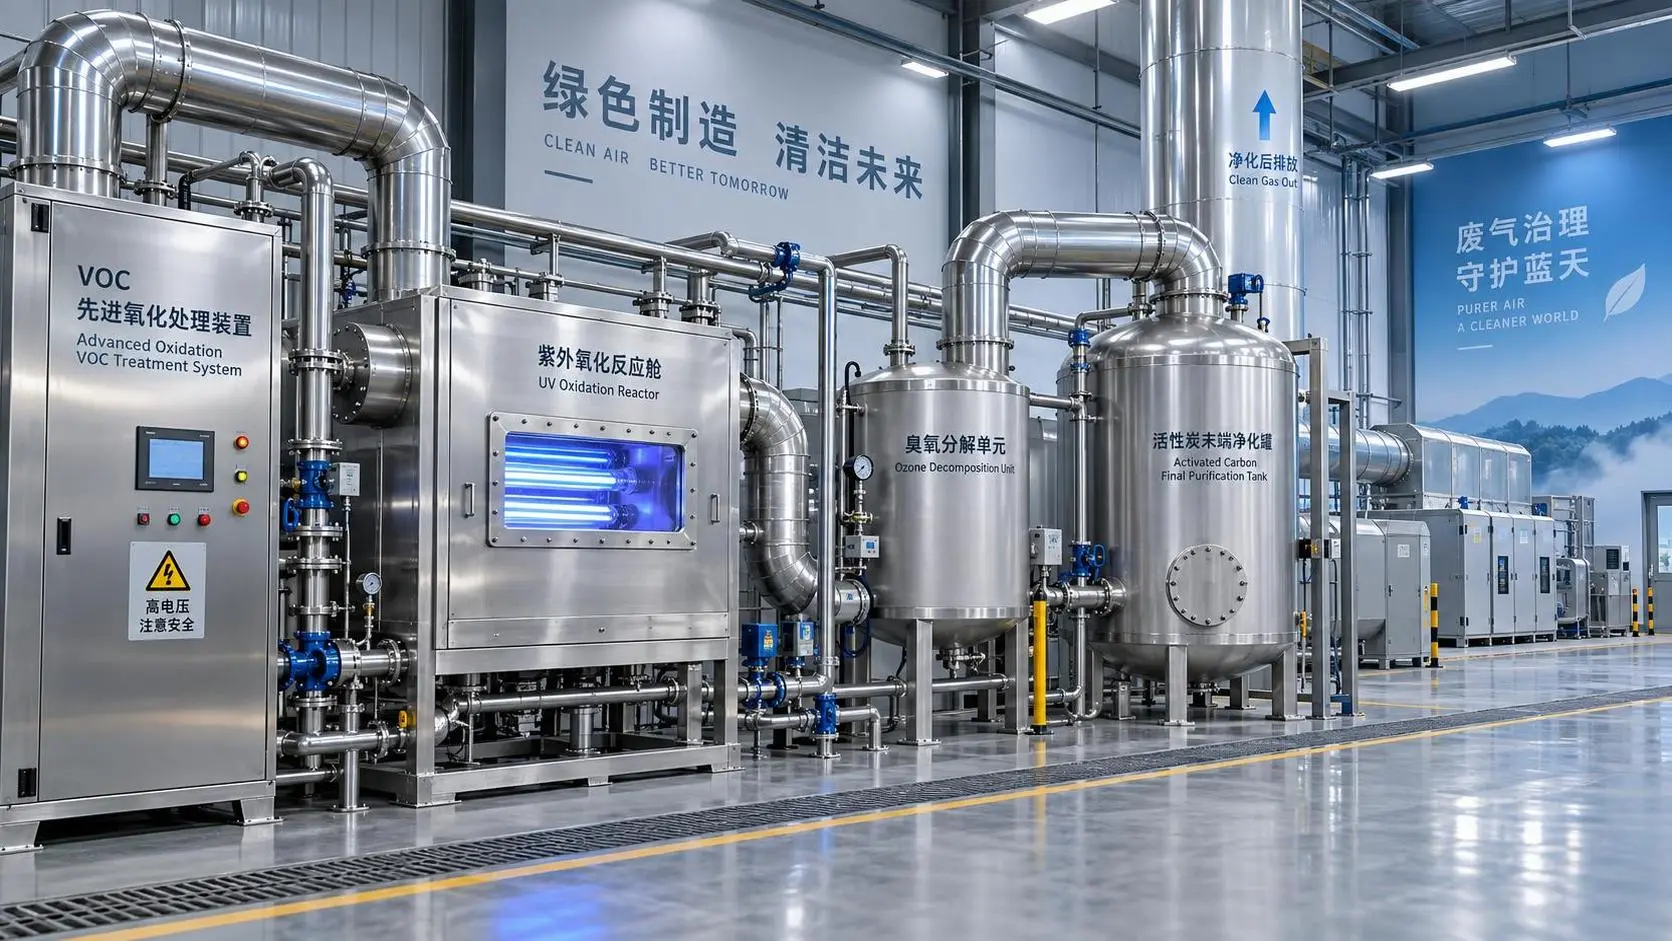
When are advanced oxidation processes the right choice for VOC control?
Advanced oxidation processes for VOC control: learn when AOPs outperform conventional options, manage by-products, and achieve reliable compliance.
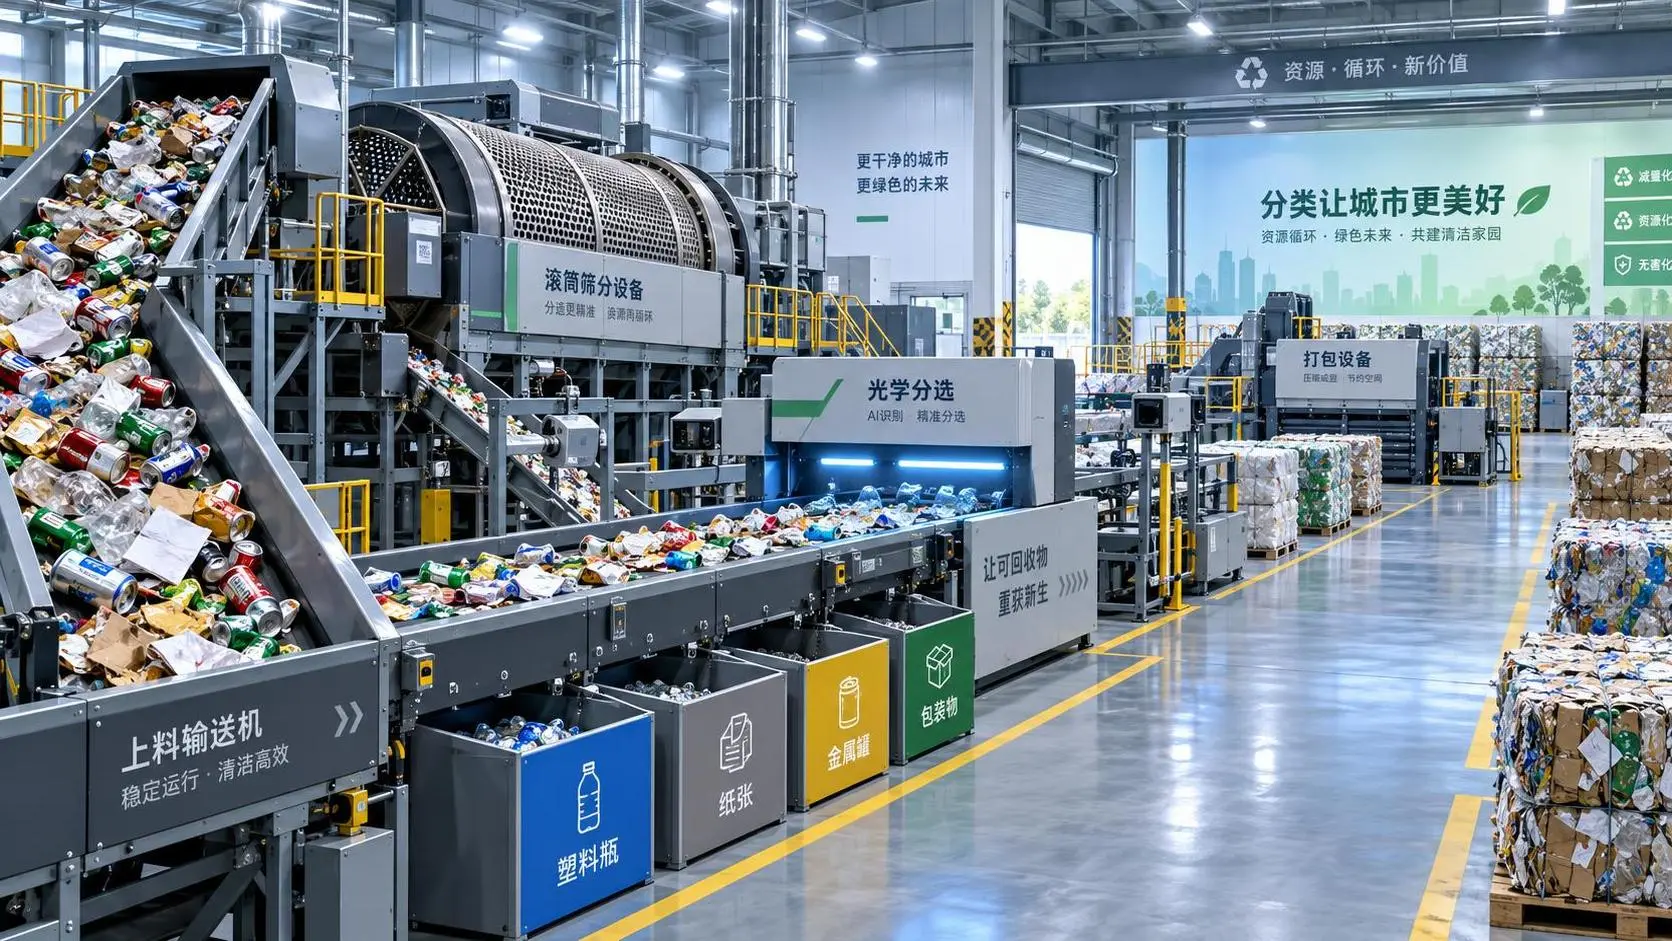
What throughput should municipal waste sorting equipment deliver?
Waste sorting equipment for municipal waste: learn how to set reliable throughput based on peak loads, material quality, uptime, and recovery targets.
What carbon neutrality means for corporate investment decisions
Carbon neutrality is transforming corporate investment decisions. Explore how lifecycle economics, efficiency, compliance, and resilience can drive measurable returns and lasting advantage.
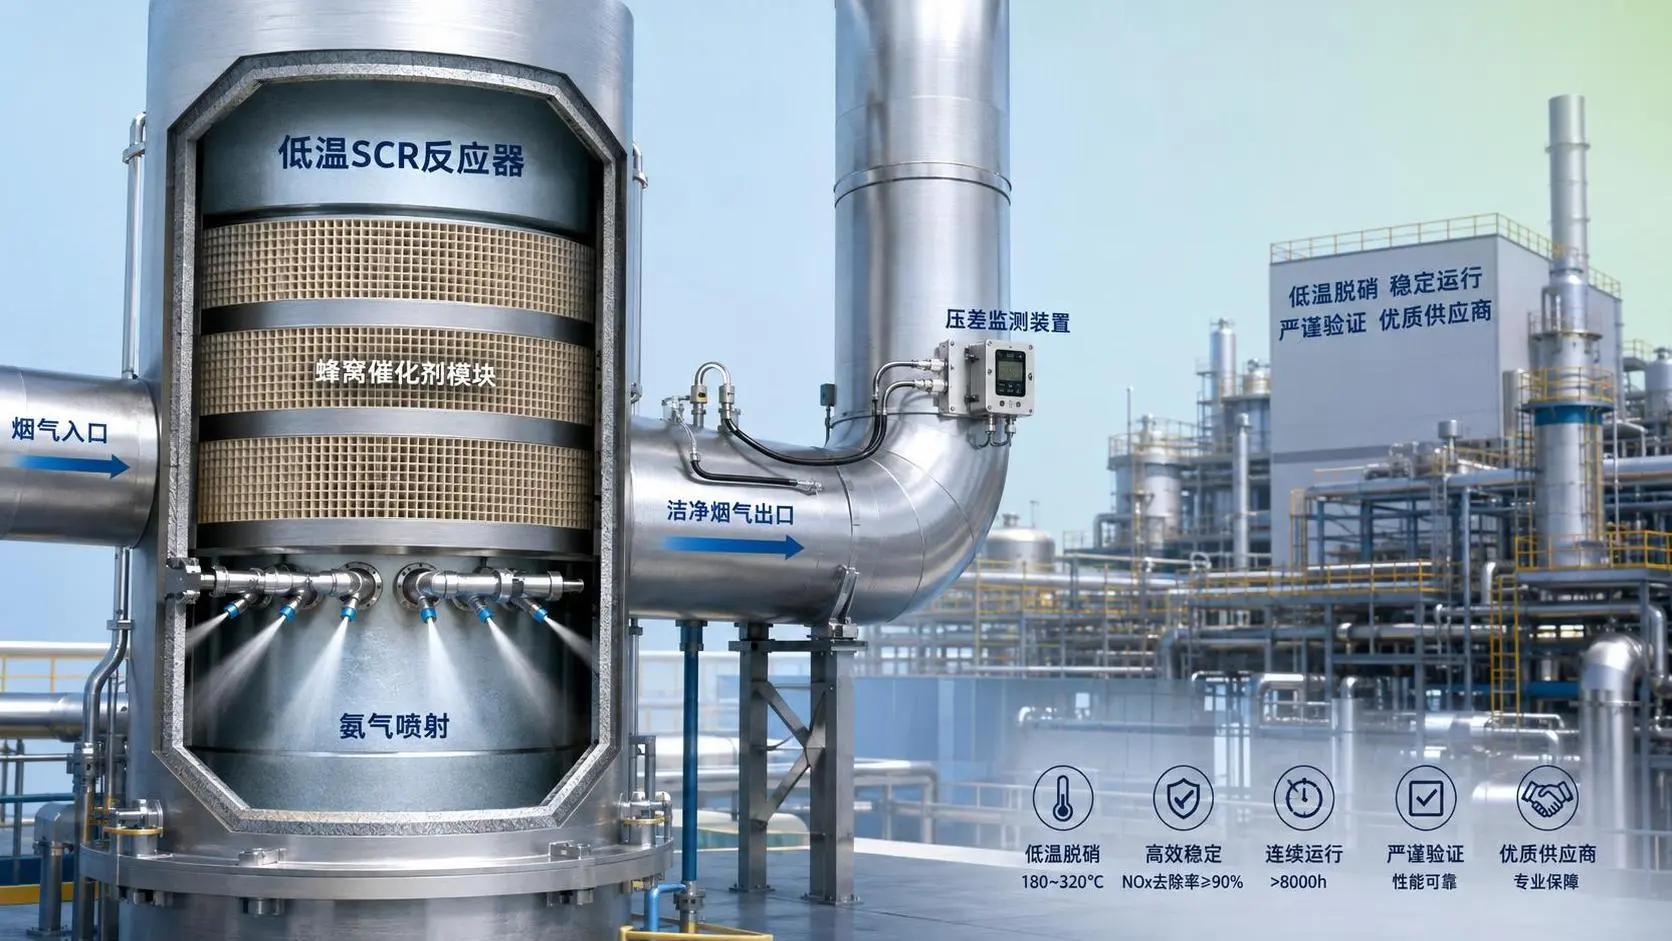
What to verify before choosing a low temperature SCR supplier
Low temperature SCR supplier checklist: verify catalyst temperature range, sulfur resistance, ammonia slip, pressure drop, lifecycle cost, and support before award.
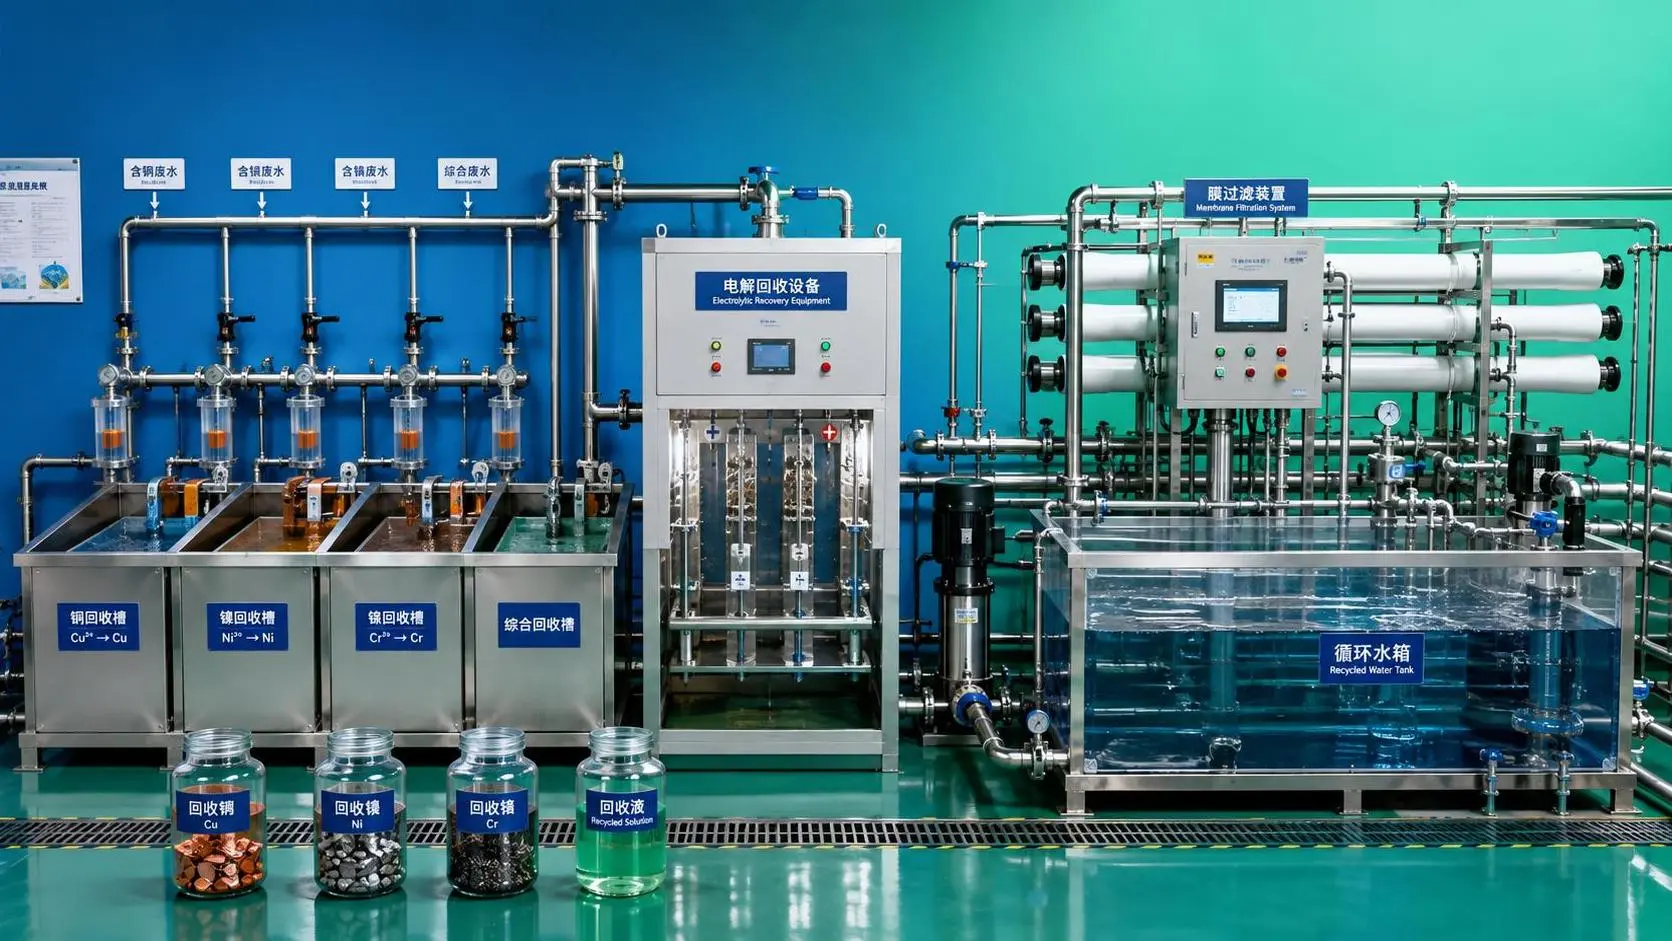
How closed-loop resource recovery for electroplating cuts metal waste
Closed-loop resource recovery for electroplating reduces metal waste, sludge, and water use through smarter stream segregation, recovery, and reuse strategies.