
Industry News
Curation by industry experts
Hot Articles
Popular Tags
Seawater Desalination Systems Capacity: How to Size for Stable Output
Seawater Desalination Systems Capacity: How to Size for Stable Output
For technical evaluation, seawater desalination systems capacity is never just a nameplate figure.
It sets the plant’s real operating window, energy profile, and compliance resilience.
A system sized only for average demand often looks efficient on paper.
In operation, it may struggle during intake swings, maintenance outages, or seasonal temperature shifts.
That is why seawater desalination systems capacity should be calculated around stable output, not optimistic assumptions.
A sound sizing model connects demand, feedwater quality, recovery targets, redundancy, and lifecycle constraints.
When those factors align, the plant delivers reliable production with fewer energy penalties and fewer emergency adjustments.
Start with Net Water Demand, Not Installed Flow
The first mistake in seawater desalination systems capacity sizing is using gross demand as the only anchor.
Stable output begins with net required product water at the delivery point.
That means subtracting storage balancing effects, recycling flows, and demand management measures where they are credible.
Then add distribution losses, cleaning water, startup waste, and performance decline allowances.
In actual projects, daily demand curves matter more than annual totals.
A plant serving industry may face sharp production peaks.
A municipal supply scheme may have morning and evening spikes with lower nighttime loading.
These patterns affect whether seawater desalination systems capacity should support direct peak production or coordinated storage support.
A practical demand review usually includes:
- Average daily product water demand
- Maximum daily and hourly demand
- Seasonal demand swings
- Emergency reserve requirements
- Future expansion over five to fifteen years
This step keeps seawater desalination systems capacity tied to actual delivery obligations instead of abstract throughput numbers.
Match Capacity to Feedwater Reality
Feedwater variability is often where stable output is won or lost.
Many sizing exercises assume steady seawater salinity, temperature, and fouling load.
Real coastlines rarely behave that way.
Algal blooms, storm runoff, tidal shifts, and thermal changes can alter membrane performance and pretreatment stability.
As a result, seawater desalination systems capacity must reflect worst credible intake conditions, not best seasonal data.
Two factors are especially important.
1. Temperature effect on membrane output
Lower seawater temperature reduces permeate flow at the same operating pressure.
If the plant is sized on warm-water performance, winter output may drop below target.
2. Fouling and pretreatment stress
High turbidity or biological loading can force reduced flux and more frequent cleaning.
That directly changes effective seawater desalination systems capacity during unstable intake periods.
From a sizing perspective, evaluators should request site-specific envelopes for salinity, SDI, temperature, and seasonal contamination events.
Without that, capacity numbers remain technically incomplete.
Use Recovery Rate Carefully
Recovery rate strongly influences seawater desalination systems capacity, intake flow, and brine management.
Higher recovery may reduce intake volume per unit of product water.
It can also increase osmotic pressure, scaling risk, and operational sensitivity.
That tradeoff matters when stable output is the core objective.
An aggressive recovery target may create a smaller apparent plant.
But the margin for upset conditions becomes narrower.
In many cases, a slightly more conservative recovery rate supports steadier performance and easier compliance control.
A useful review question is simple: does the proposed recovery rate still hold under low temperature, membrane aging, and fouling events?
If not, the quoted seawater desalination systems capacity may be too optimistic for real duty.
Build in Redundancy and Operating Margin
Stable production depends on more than membrane trains alone.
Intake pumps, pretreatment units, cartridge filters, high-pressure pumps, energy recovery devices, and post-treatment steps all affect available output.
That is why seawater desalination systems capacity should be evaluated as dependable plant capacity, not isolated RO capacity.
Redundancy strategy usually follows the project’s service criticality.
Industrial backup supply may tolerate short derating.
Public water supply often requires stronger N+1 or train-based standby logic.
In practical terms, operating margin should cover:
- Membrane performance decline over time
- Scheduled cleaning and maintenance downtime
- Temporary pretreatment derating
- Partial equipment outage
- Future tightening of product water standards
A common evaluation error is selecting seawater desalination systems capacity with almost no margin because the bid looks more efficient.
That decision often shifts risk into operations, where it becomes more expensive.
Check Energy Performance at Real Load Points
Energy use is closely tied to seawater desalination systems capacity selection.
Still, specific energy consumption should not be reviewed only at design-point output.
Plants rarely operate at one perfectly stable condition.
More revealing signals come from part-load behavior, startup frequency, and train turndown flexibility.
If seawater desalination systems capacity is oversized without a sensible control strategy, the plant may run inefficiently for long periods.
If it is undersized, operators may push pressure and cleaning frequency to protect output.
A better review compares performance across several operating points.
This approach gives a more realistic view of how seawater desalination systems capacity performs through the year.
Account for Expansion, Compliance, and Commercial Risk
Capacity sizing also shapes future optionality.
That includes phased expansion, chemical storage, brine discharge limits, and future product water requirements.
From recent market changes, this matters more than before.
Coastal infrastructure now faces tighter energy scrutiny and stronger environmental permitting pressure.
That means seawater desalination systems capacity should not be chosen as a stand-alone hydraulic number.
It should be checked against the full project risk envelope.
At ESD, this broader lens is increasingly important across large water treatment and heavy seawater desalination decisions.
The stronger signal is that reliable output now carries strategic value beyond pure production cost.
It affects bid credibility, operating permits, and long-term supply security.
A disciplined review should therefore ask:
- Can the plant expand without major shutdown reconstruction?
- Will brine and intake permits still hold under future operating scenarios?
- Does the selected capacity support contractual performance guarantees?
- Are lifecycle costs still acceptable under less favorable conditions?
A Practical Sizing Framework
For structured decision-making, seawater desalination systems capacity can be screened in five steps.
- Define net product water demand by day, season, and emergency condition.
- Model feedwater extremes, including low temperature and fouling events.
- Test recovery rate assumptions against real operating margins.
- Verify dependable output with redundancy and maintenance scenarios.
- Compare energy, compliance, and expansion risk across candidate sizes.
This keeps seawater desalination systems capacity grounded in performance certainty rather than vendor headline numbers.
In other words, the best size is not the largest or the cheapest.
It is the one that keeps output stable when real conditions turn less cooperative.
That is the standard worth applying before any final selection decision.
Recommended News
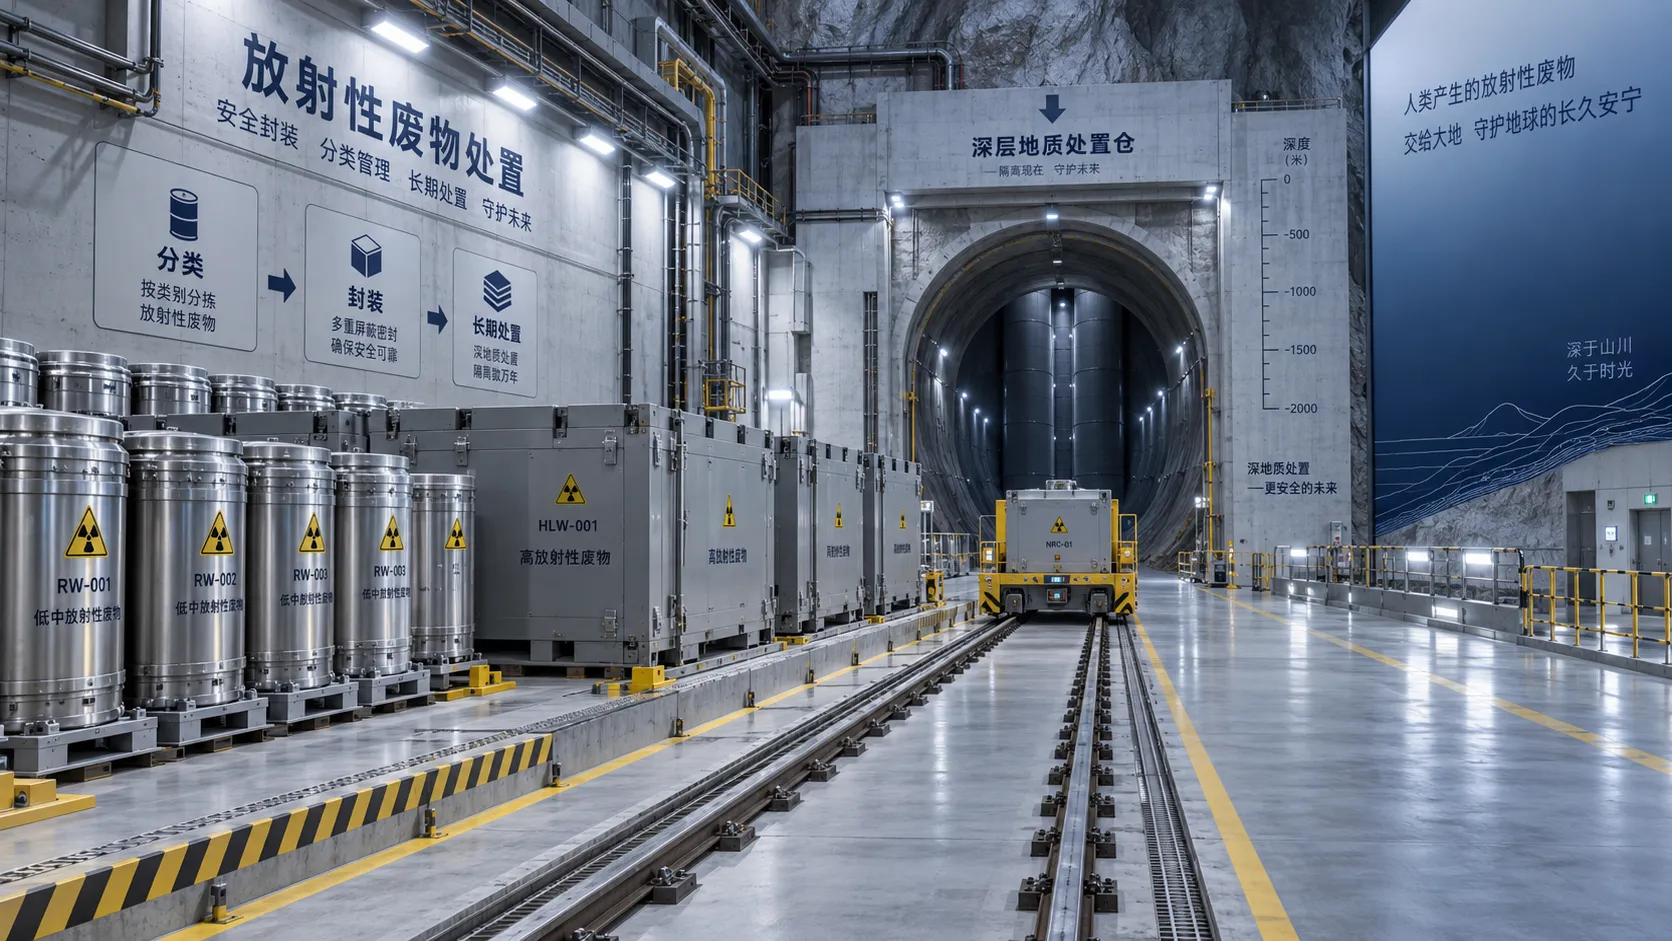
What drives radioactive waste cost over the life of a disposal project?
Radioactive waste cost depends on classification, treatment, transport, storage, disposal access, and long-term compliance. Explore the key lifecycle cost drivers.
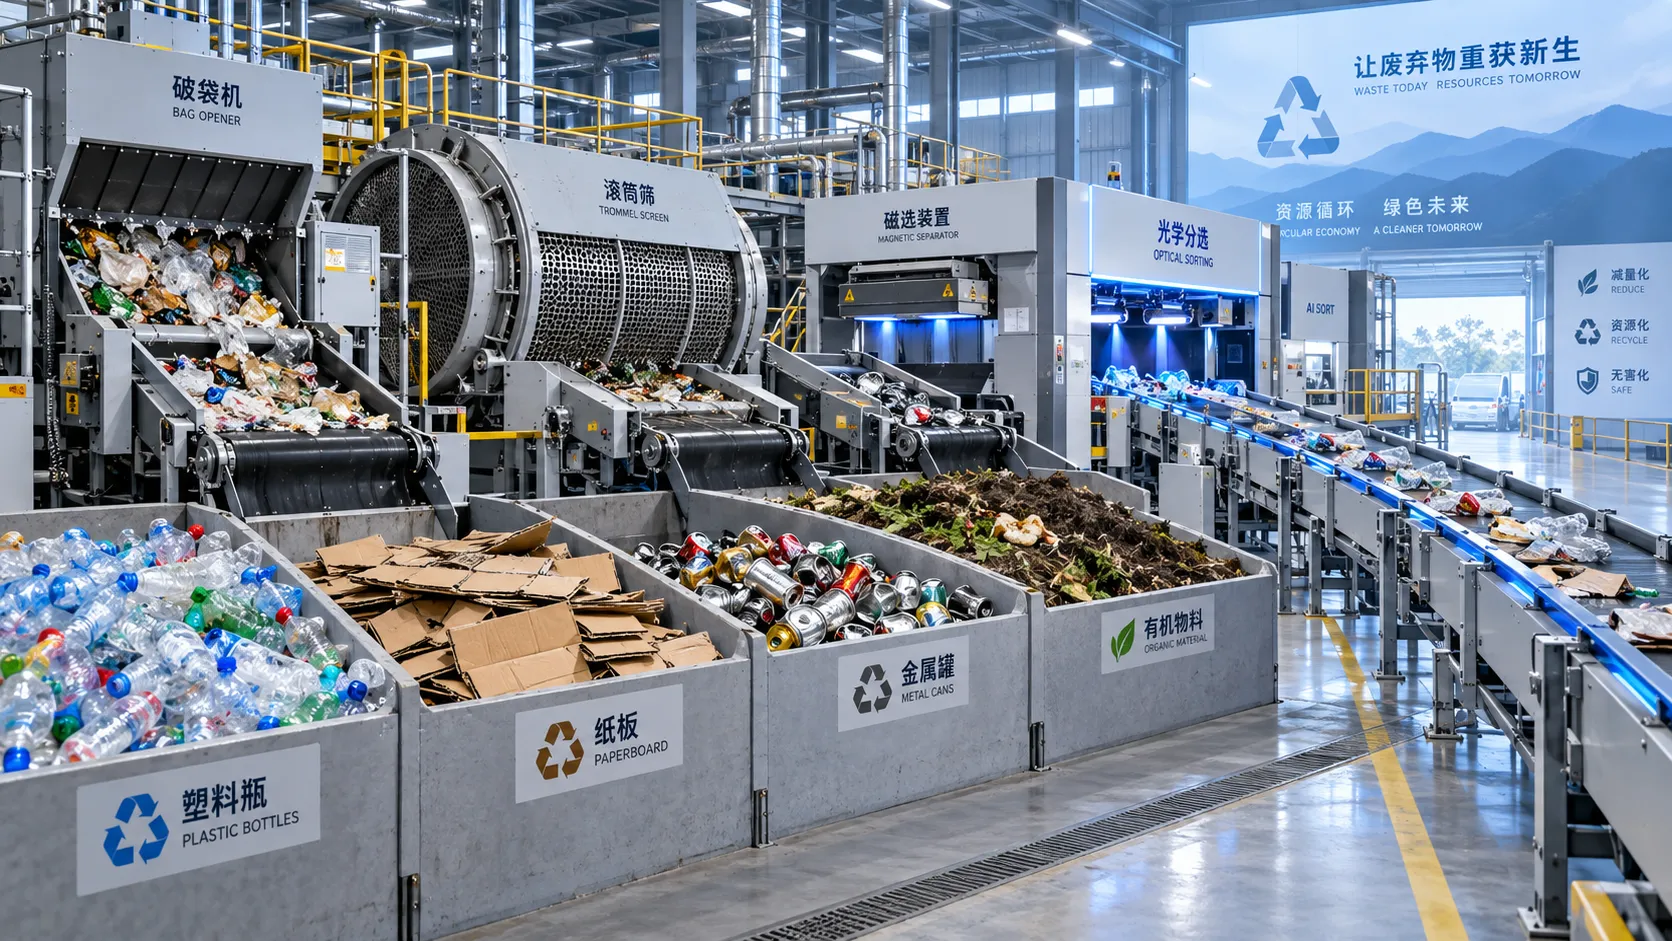
How to choose solid waste equipment based on waste stream characteristics
Environmental equipment guide for solid waste: discover how to match sorting, treatment, and recovery equipment to waste composition, moisture, contamination, and output goals.
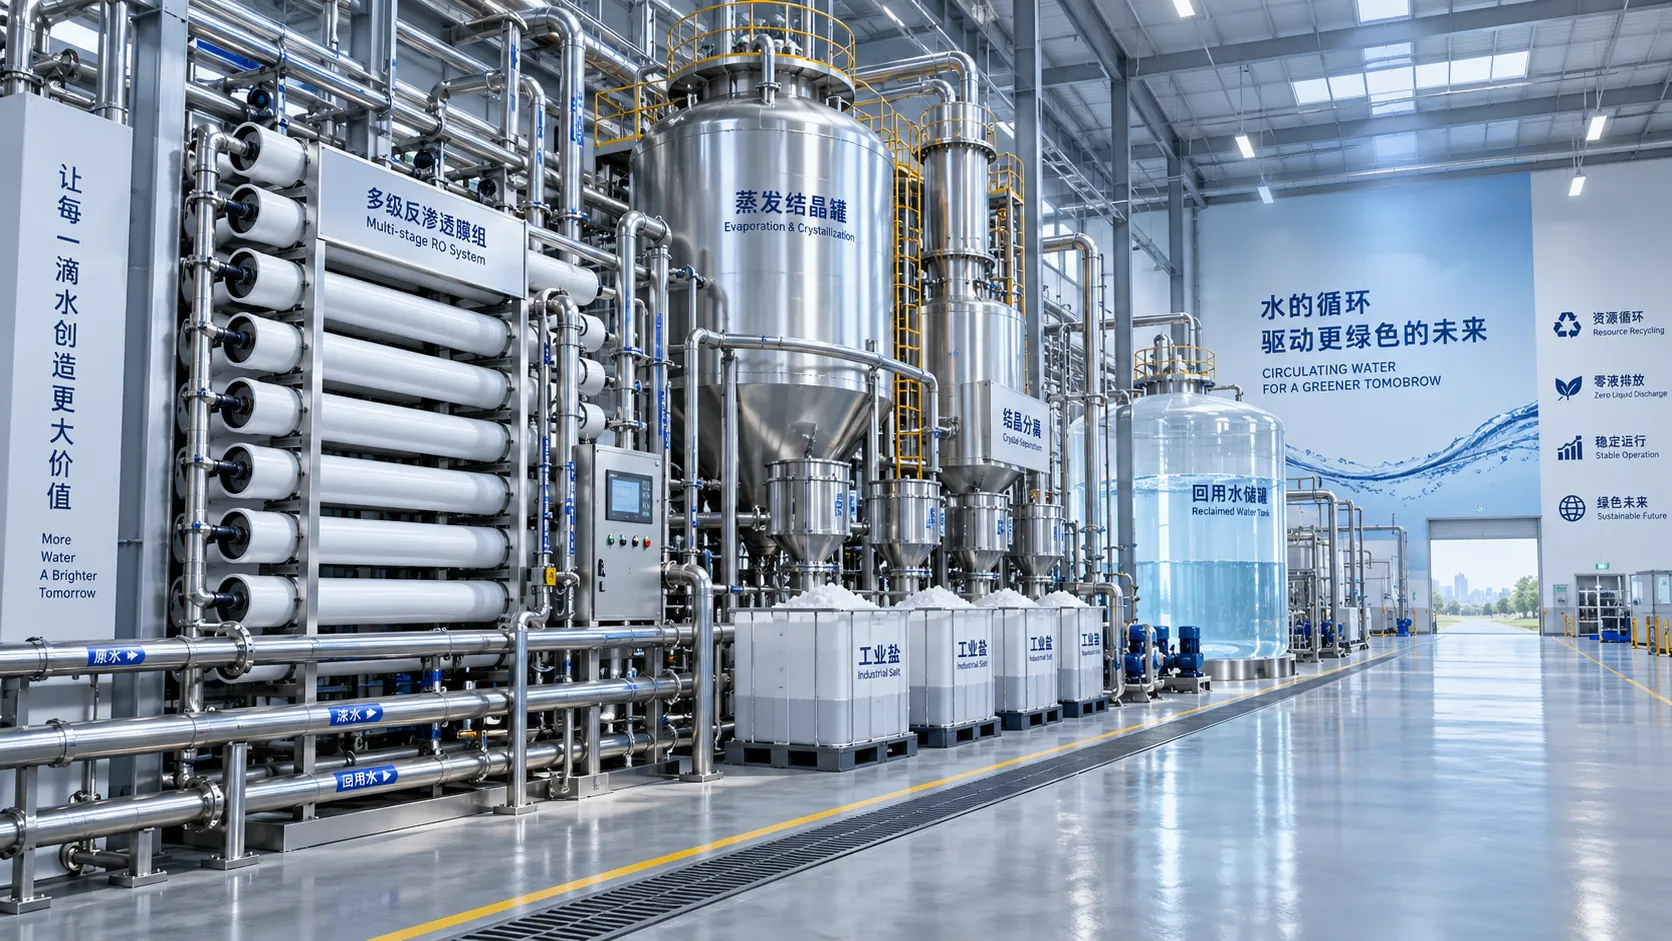
When does high recovery ZLD equipment justify its higher capital cost?
High recovery ZLD equipment can justify higher capital cost when water scarcity, discharge risks, brine disposal, and downtime threaten operations. Explore the decision factors.

How high purity heavy metal recovery affects recovered metal value
High purity heavy metal recovery boosts recovered metal value by improving payability, reducing penalties, and unlocking stronger buyer opportunities. Explore smarter netback strategies.
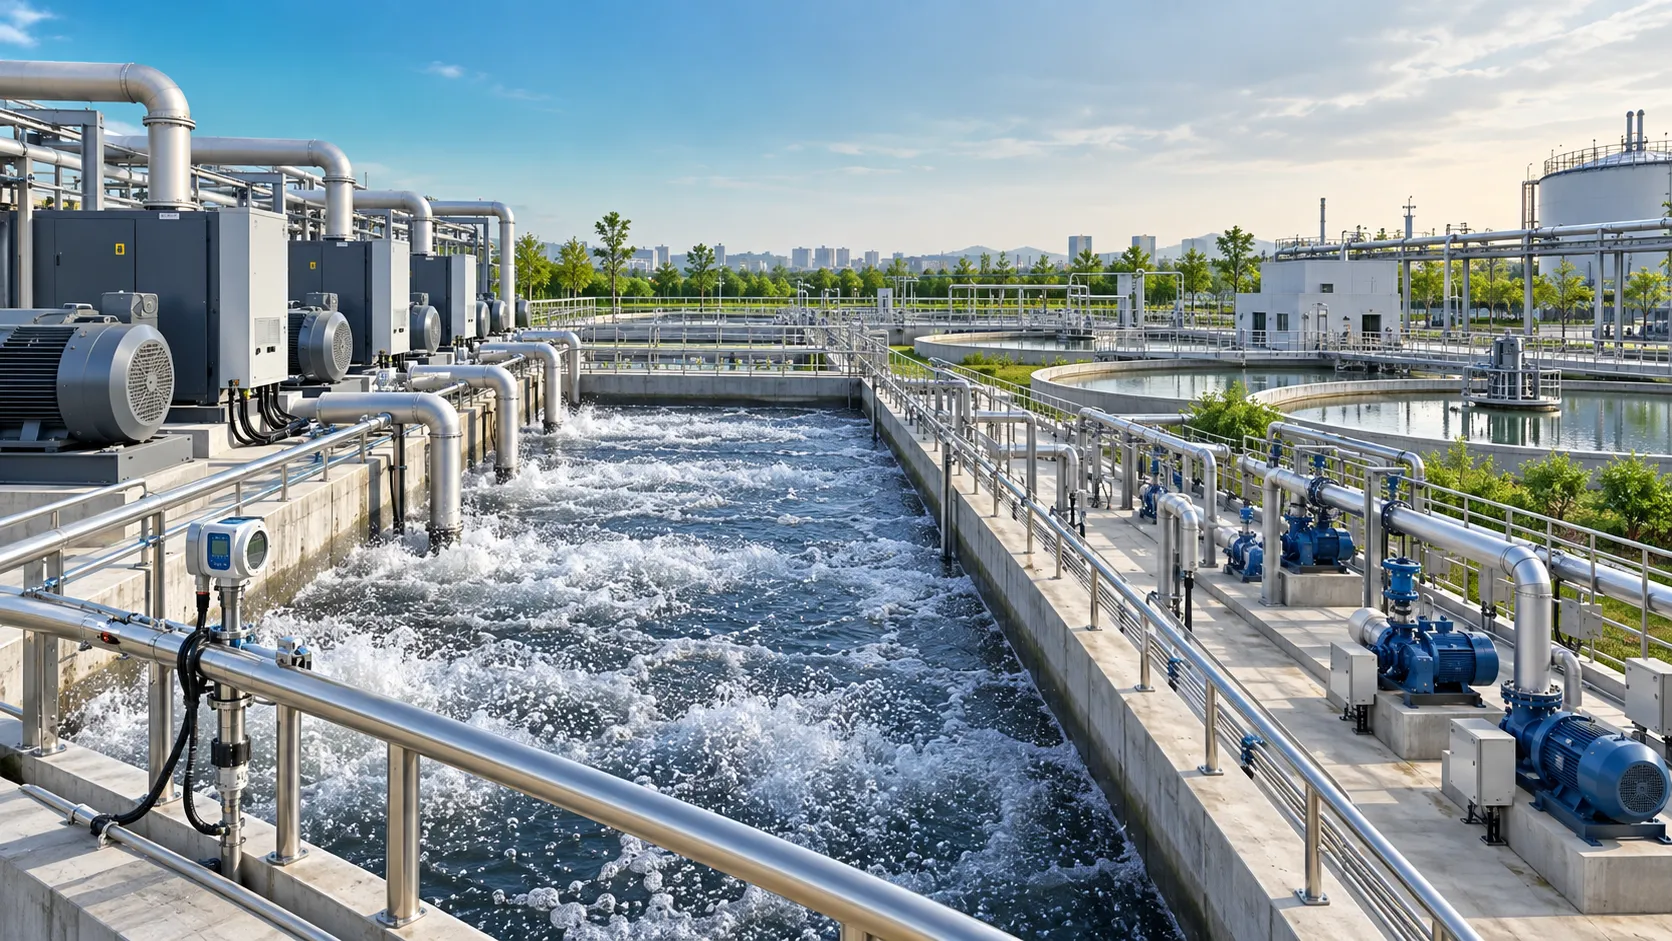
When does environmental equipment intelligence reduce wastewater plant energy use?
Environmental equipment intelligence for wastewater plants cuts energy use through smarter aeration, pumping, and data-driven controls—without compromising compliance. Discover when it delivers measurable savings.
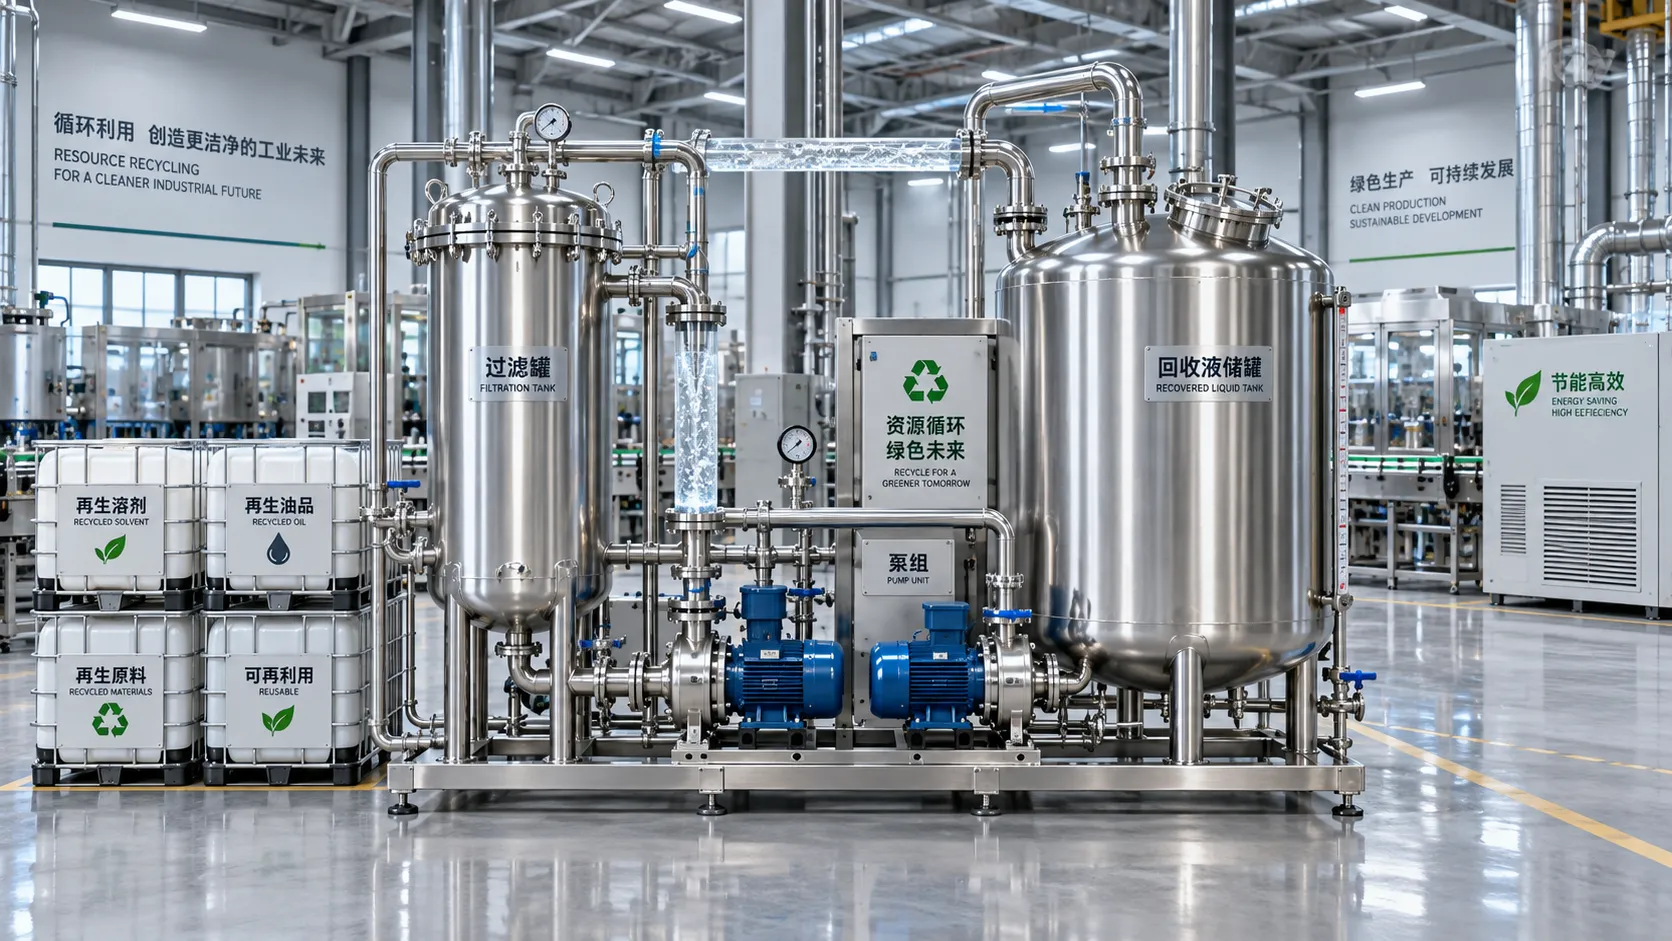
How to Calculate Product Recovery System Payback from Yield, Energy, and Labor Savings
Product recovery system payback: learn to model yield value, energy and labor savings, operating costs, and scenarios for a defensible capital approval case.
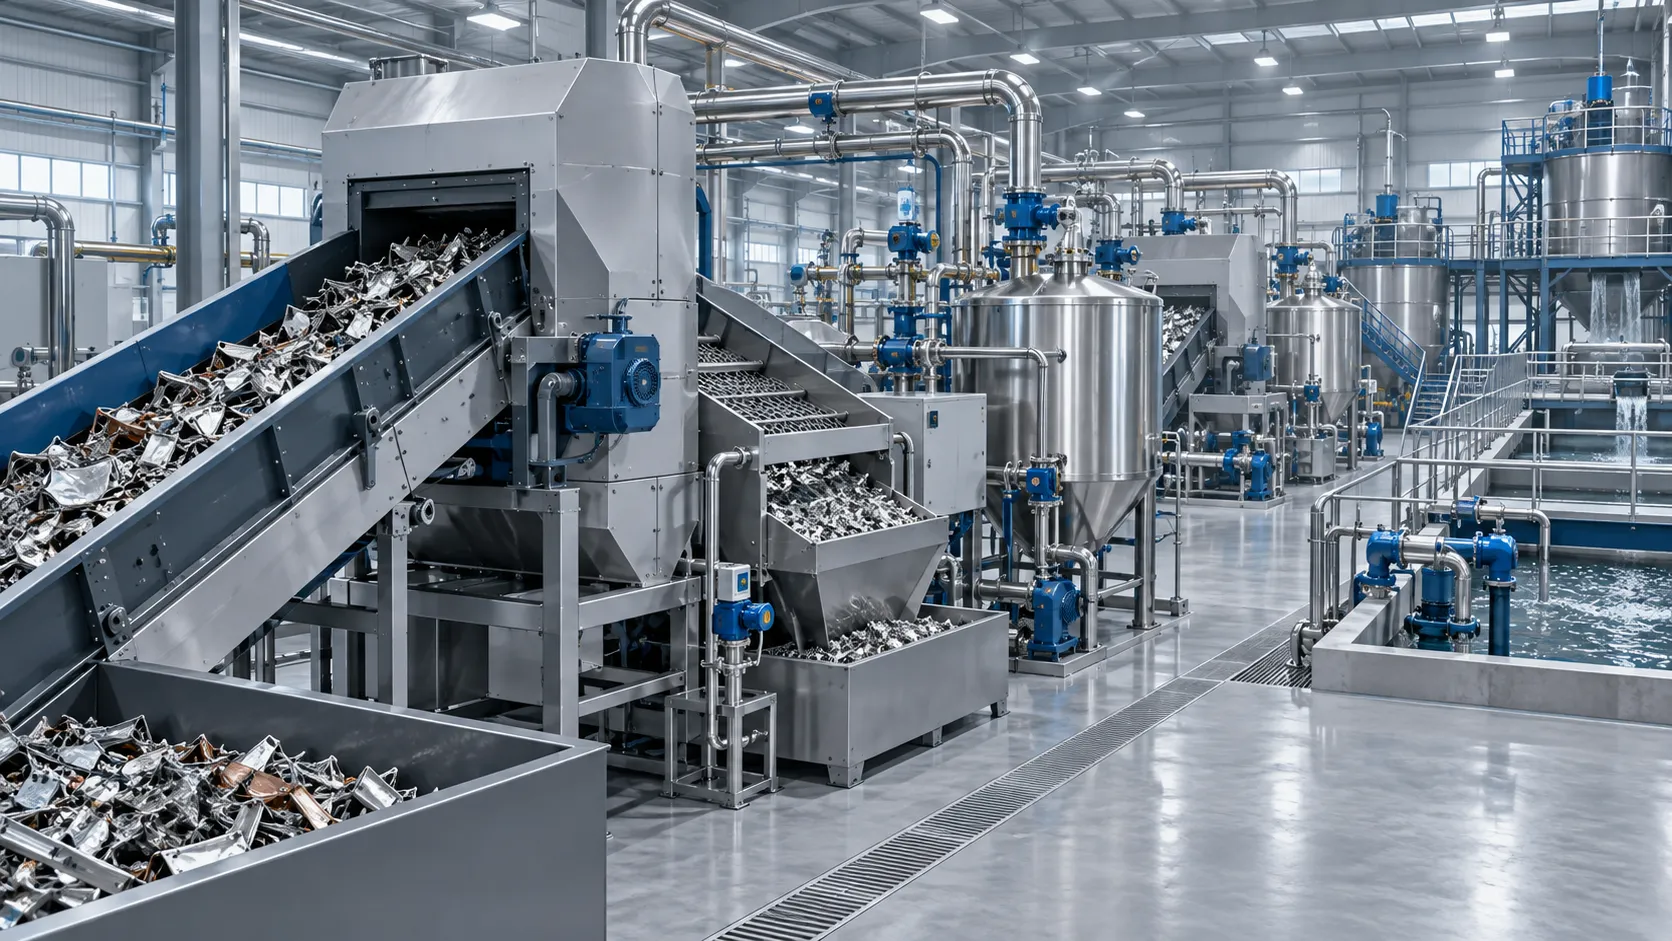
What Makes Metals Recovery Infrastructure Repeatable Across Multiple Plant Sites?
Repeatable metals recovery infrastructure: learn how standardized processes, modular design, data control, and compliance-ready systems enable scalable multi-site recovery plants.
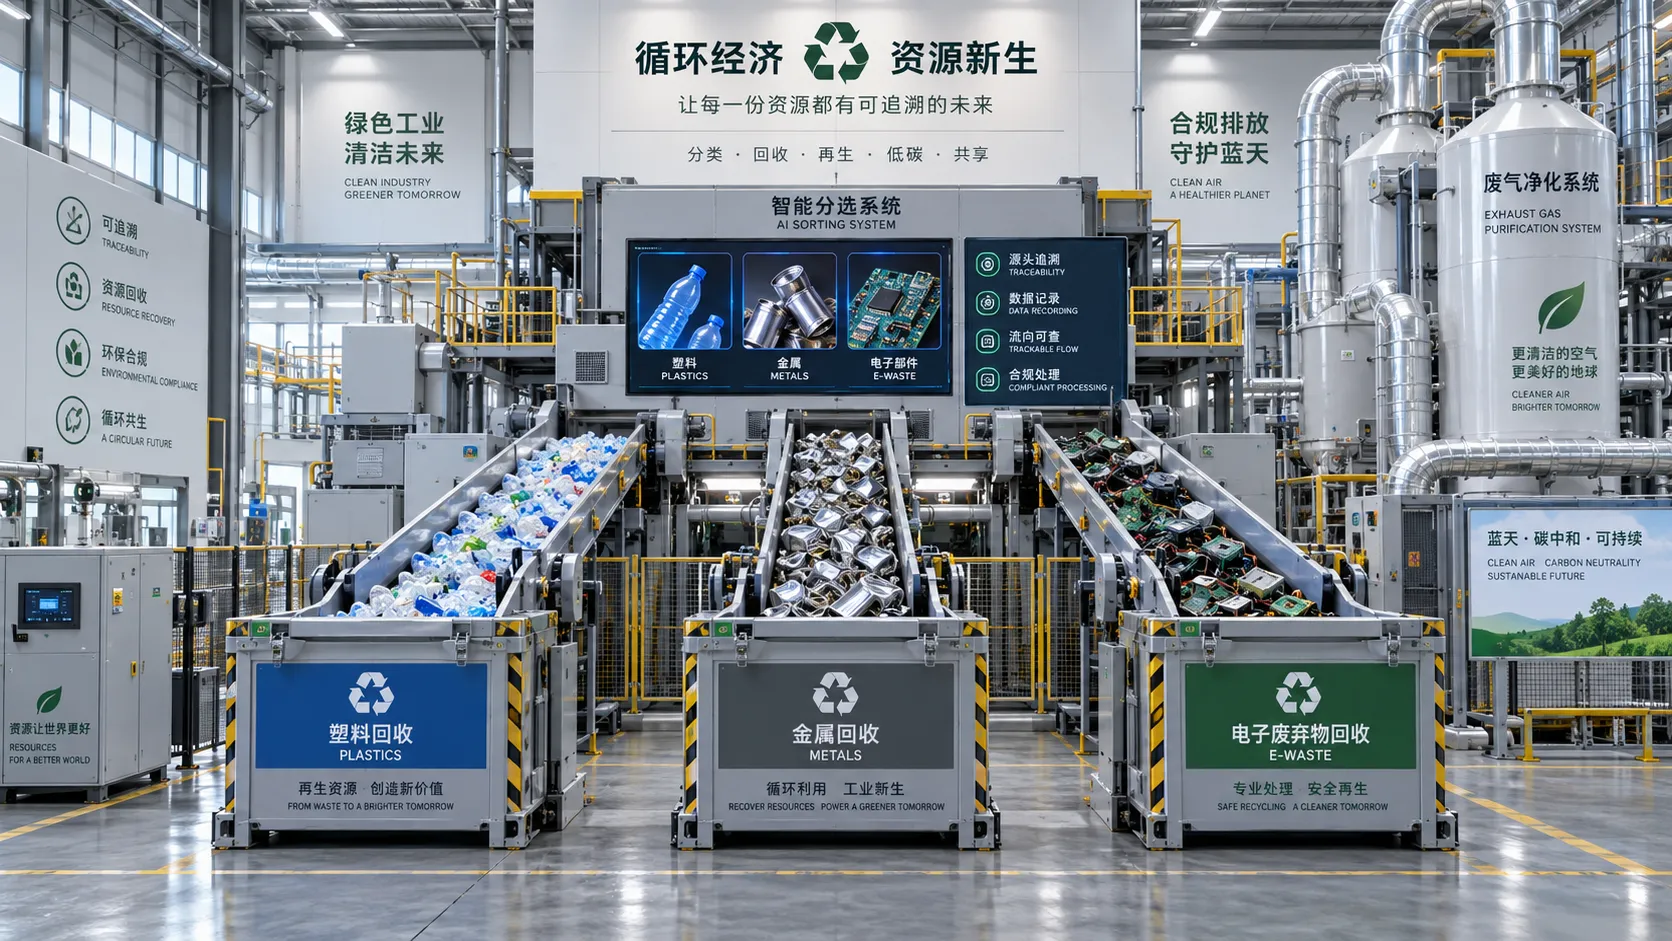
Waste Management and Circular Economy Regulations to Watch in 2025–2026
Recent regulatory updates in waste management and circular economy 2025-2026: explore PPWR, EPR, waste shipments, PFAS controls, and practical compliance steps.
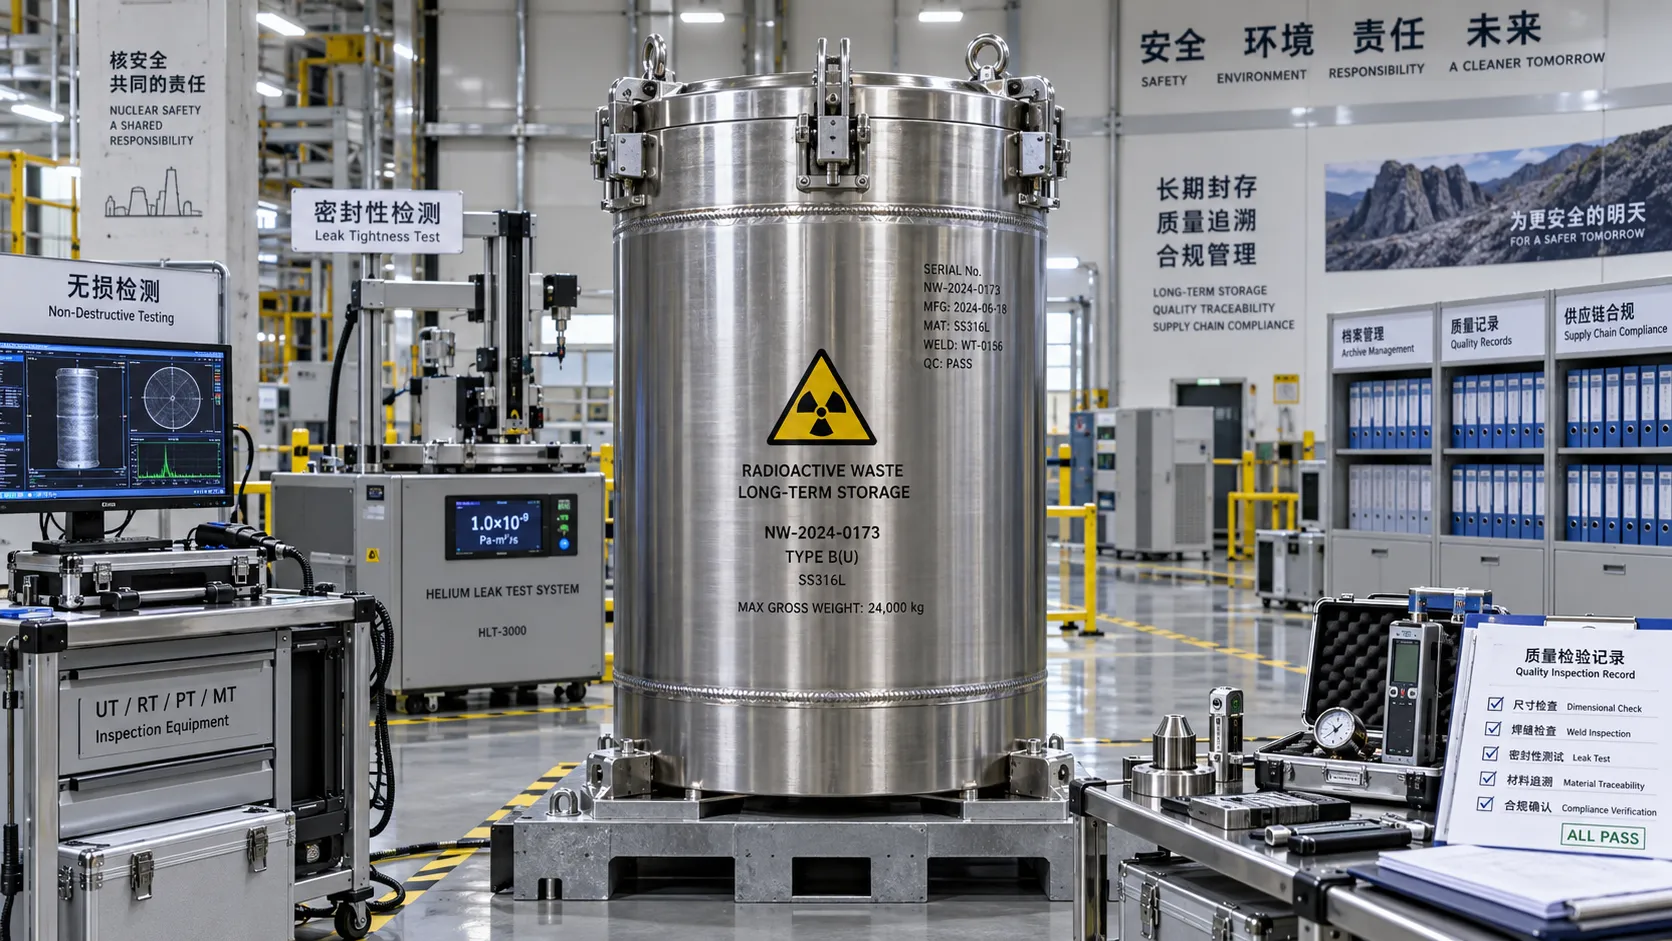
How to Qualify Nuclear Waste Supply Chain Partners for Long-Term Projects
Nuclear waste supply chain partner qualification: learn how to verify technical capability, compliance, traceability, resilience, and lifecycle support for long-term projects.