
Industry News
Curation by industry experts
Hot Articles
Popular Tags
CBAM Impact Reporting: Key Cost Risks and Data Gaps in 2026
Why is CBAM impact reporting suddenly a 2026 cost issue?
CBAM impact reporting is no longer a narrow customs exercise. It now affects pricing, supplier qualification, contract risk, and access to regulated export markets.
That shift matters across environmental engineering chains. Water treatment skids, flue gas modules, desalination trains, recovery systems, and high-spec containment equipment all depend on carbon-intensive inputs.
Steel, cement, aluminum, electricity, fabricated assemblies, and specialist process parts can all carry embedded emissions exposure. The invoice is only one part of the story.
The harder issue is visibility. Many firms can estimate direct energy use, yet struggle to document supplier emissions with a method accepted by buyers, auditors, or regulators.
In practice, CBAM impact reporting becomes a margin defense tool. If the reporting base is weak, the business may overpay, underquote, or lose credibility during tenders.
This is why market intelligence platforms such as ESD increasingly connect technical equipment data with compliance signals. Carbon exposure is now part of equipment intelligence, not a separate paperwork task.
Where do the biggest CBAM cost risks usually hide?
Most teams first look at certificate prices or possible border charges. That is necessary, but it rarely captures the full commercial risk.
The more expensive problems often appear earlier, inside procurement, engineering design, and supplier onboarding. Once a project is bid, correction becomes costly.
- Supplier data arrives late, delaying compliant declarations and shipment release planning.
- Emissions are calculated with mixed boundaries, making one supplier look cheaper only because the method is narrower.
- Fallback values are used too often, pushing reported embedded emissions above actual performance.
- Engineering changes after bid award alter material intensity, but reporting baselines are not updated.
- Carbon cost clauses are absent, leaving one party exposed when reporting assumptions fail.
For heavy environmental systems, this can be material. A desalination package, ZLD line, or flue gas treatment upgrade contains extensive fabricated metal, pressure parts, and energy-intensive components.
The same pattern reaches circular economy assets too. Pyrolysis units, AI sorting lines, and residue handling systems often combine imported assemblies from several reporting cultures.
CBAM impact reporting therefore influences total landed cost, negotiation leverage, and even whether a low-carbon claim can survive external review.
Are data gaps really more dangerous than the carbon price itself?
Often, yes. A known carbon price can be modeled. A weak data chain creates uncertainty that spreads through budgeting, bid strategy, and compliance timing.
The common assumption is that any emissions number is better than none. That is risky. Poor-quality numbers may still fail validation and trigger rework.
More importantly, bad data distorts comparison. One supplier may provide plant-level measurements, while another submits generic factors from an unrelated geography or production route.
That difference matters when selecting process equipment. In ESD-covered sectors, technical performance and compliance traceability increasingly move together.
A membrane system, scrubber module, or waste stabilization unit can look equivalent on process output, yet carry very different reporting confidence levels.
A useful way to judge the situation is to separate emissions data into three questions: is it complete, is it consistent, and is it auditable?
If one of those three answers is weak, CBAM impact reporting becomes fragile. The cost exposure then extends far beyond the nominal carbon charge.
Which operations feel the pressure first across industrial and environmental value chains?
The pressure usually appears where cross-border engineering meets material intensity. Large projects with custom fabrication are especially exposed.
This includes EPC-linked procurement for desalination, municipal and industrial water treatment, flue gas cleanup, solid waste recovery, and selected nuclear support systems.
The reason is simple. These projects rely on multiple tiers of metals, power-intensive processing, and specialized subassemblies from different regions.
Even when the final export item is not a basic commodity, embedded emissions from covered materials can still shape reporting complexity and cost pass-through.
A common blind spot sits in replacement parts and retrofit packages. Short lead times often push teams toward available stock, while emissions documentation is checked too late.
Another early pressure point is strategic bidding. If one bidder has traceable low-carbon sourcing and another relies on assumptions, the second may appear cheaper only on paper.
That is why ESD-style intelligence has value. Tracking regulation, process design, and equipment evolution together helps reveal where reporting quality changes commercial outcomes.
How should a business compare suppliers when methodologies do not match?
Do not start with the headline emissions number. Start with comparability. Two low numbers built on different boundaries are not decision-grade.
A workable comparison framework usually includes technical equivalence, reporting boundary alignment, verification depth, and contractual accountability.
- Confirm that the same product configuration is being measured.
- Check whether electricity, heat, scrap content, and upstream inputs are treated the same way.
- Ask for the production period and plant identity behind the declaration.
- Review whether the supplier has used internal estimates or measured process data.
- Tie commercial remedies to reporting failure, not only delivery failure.
In actual procurement cycles, the best choice is not always the lowest current carbon figure. It is often the source with the strongest evidence and update discipline.
CBAM impact reporting rewards reliable documentation. That reliability reduces repricing, avoids emergency substitutions, and supports cleaner negotiations with downstream buyers.
What should be done now if 2026 reporting still feels fragmented?
The immediate goal is not perfection. It is to build a reporting structure that can survive commercial use, external review, and supplier change.
A sensible first step is to map the highest-risk material and equipment families. Focus on products with high carbon intensity, high import value, or repeated tender exposure.
Then standardize the questions sent to suppliers. Without one reporting template, CBAM impact reporting quickly becomes a patchwork of spreadsheets and assumptions.
It also helps to separate strategic and operational timelines. Quarterly intelligence reviews should watch regulation and market signals, while project teams manage declaration readiness lot by lot.
For technical sectors such as ZLD, SWRO, FGD, resource recovery, and nuclear waste support, data governance should sit close to engineering change control.
That prevents a familiar problem: process redesign improves performance, but the emissions profile in procurement files remains outdated.
A practical readiness checklist
- Rank imported materials and assemblies by carbon cost sensitivity.
- Create one internal method note for boundaries, units, and evidence rules.
- Screen suppliers for data quality before final award, not after shipment planning.
- Add update triggers for design revisions, source changes, and energy mix shifts.
- Review tender terms for carbon pass-through, fallback values, and reporting liability.
The wider point is clear. CBAM impact reporting should be treated as a commercial control system linked to sourcing, engineering, and compliance intelligence.
As 2026 approaches, the businesses that move early will not simply report better. They will quote with more confidence, defend margins more effectively, and protect market access with fewer surprises.
Recommended News

How high purity heavy metal recovery affects recovered metal value
High purity heavy metal recovery boosts recovered metal value by improving payability, reducing penalties, and unlocking stronger buyer opportunities. Explore smarter netback strategies.
When does environmental equipment intelligence reduce wastewater plant energy use?
Environmental equipment intelligence for wastewater plants cuts energy use through smarter aeration, pumping, and data-driven controls—without compromising compliance. Discover when it delivers measurable savings.
What Evidence Supports the Long-Term Safety Case for Geological Disposal?
Long-term safety of geological disposal: explore the evidence behind multi-barrier systems, site science, uncertainty testing, and auditable safety cases.
What Do Seawater Disinfection Systems Cost Over Their Full Operating Life?
What are the costs associated with seawater disinfection systems? Explore lifecycle expenses for equipment, energy, chemicals, maintenance, compliance, and risk.
How to Improve Industrial Seawater Quality Before Cooling or Membrane Treatment
How can I improve the quality of seawater used for industrial processes? Explore proven pretreatment strategies for cooling systems and RO membranes.
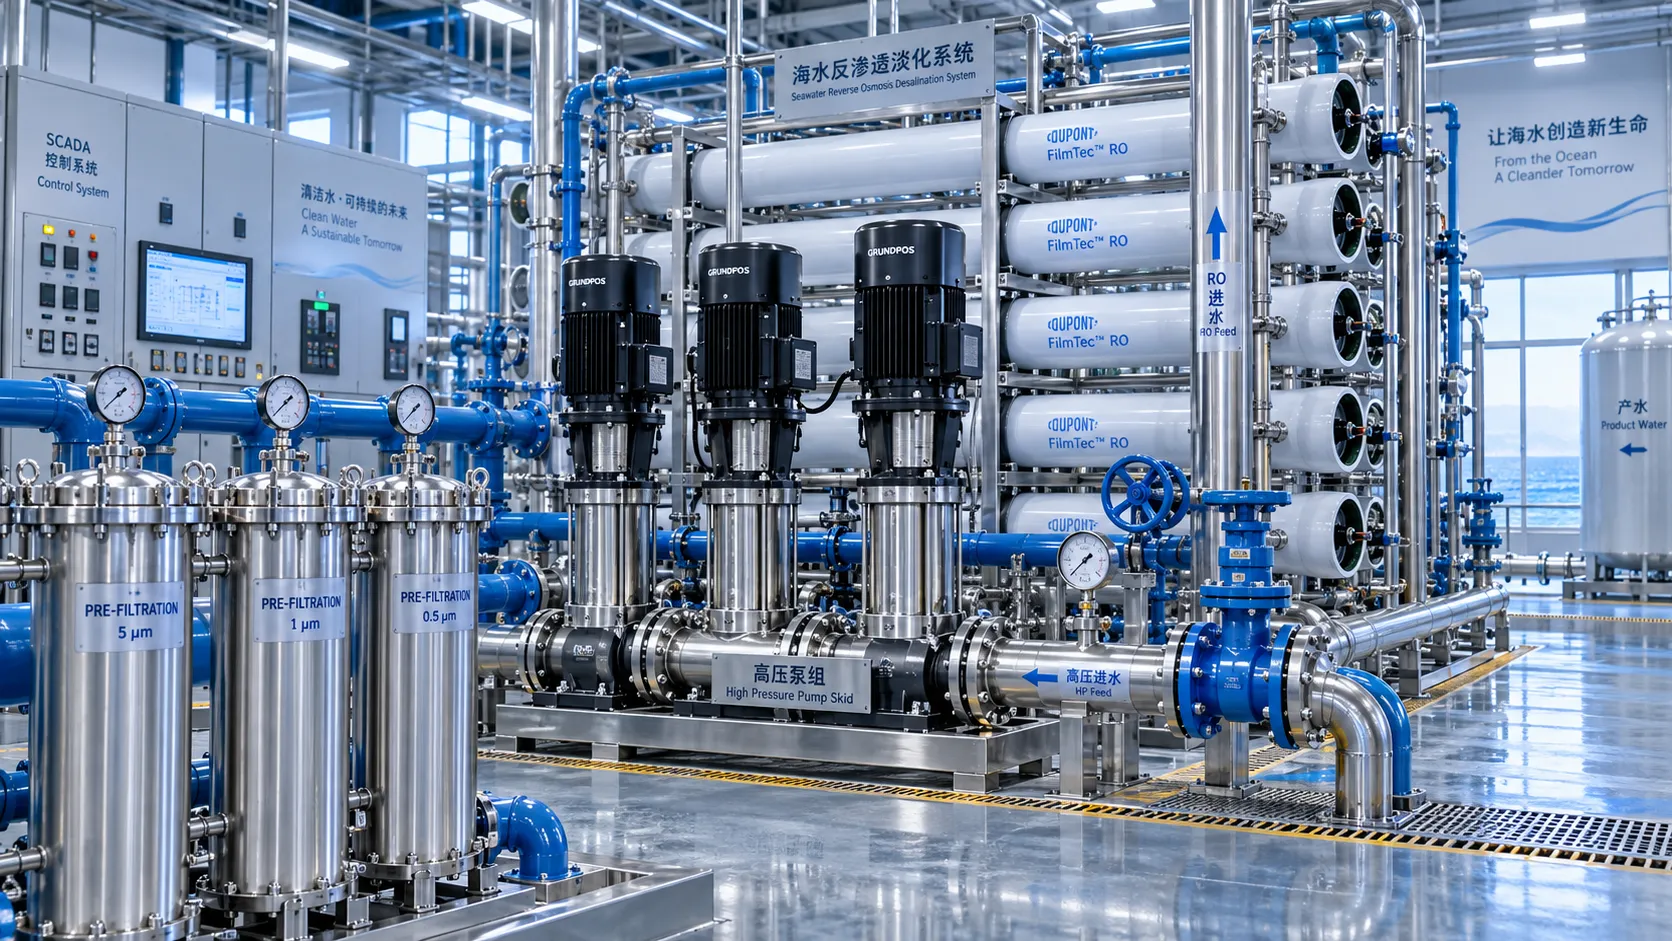
Desalination Plant Maintenance Priorities That Prevent Unplanned Downtime
Desalination plant maintenance priorities that reduce unplanned downtime: protect pretreatment, RO membranes, pumps, chemical dosing, and critical controls.

Which supplier evaluation support tools improve audit consistency?
Supplier evaluation support tools improve audit consistency with controlled checklists, evidence capture, risk scoring, CAPA workflows, and traceable approvals. Explore the essentials.

How reactor retention time affects denitrification equipment performance
Denitrification equipment reactor performance depends on retention time, carbon, mixing, and load control. Explore practical insights for reliable nitrogen removal.

How feed salinity affects energy use in ZLD system brine treatment
ZLD system brine treatment: discover how feed salinity drives energy use, scaling risk, and technology choices for efficient, reliable zero liquid discharge.